
Industry
Insights
Product
SaaS Platform
GFK
GFK are the largest market research company in Germany, and the fourth largest in the world. They provide data and intelligence to the consumer goods industry, enabling brands to compare their own market performance, with that of their competitors.
I joined them during a digital transformation phase, where they were preparing the company for a takeover.
Overview
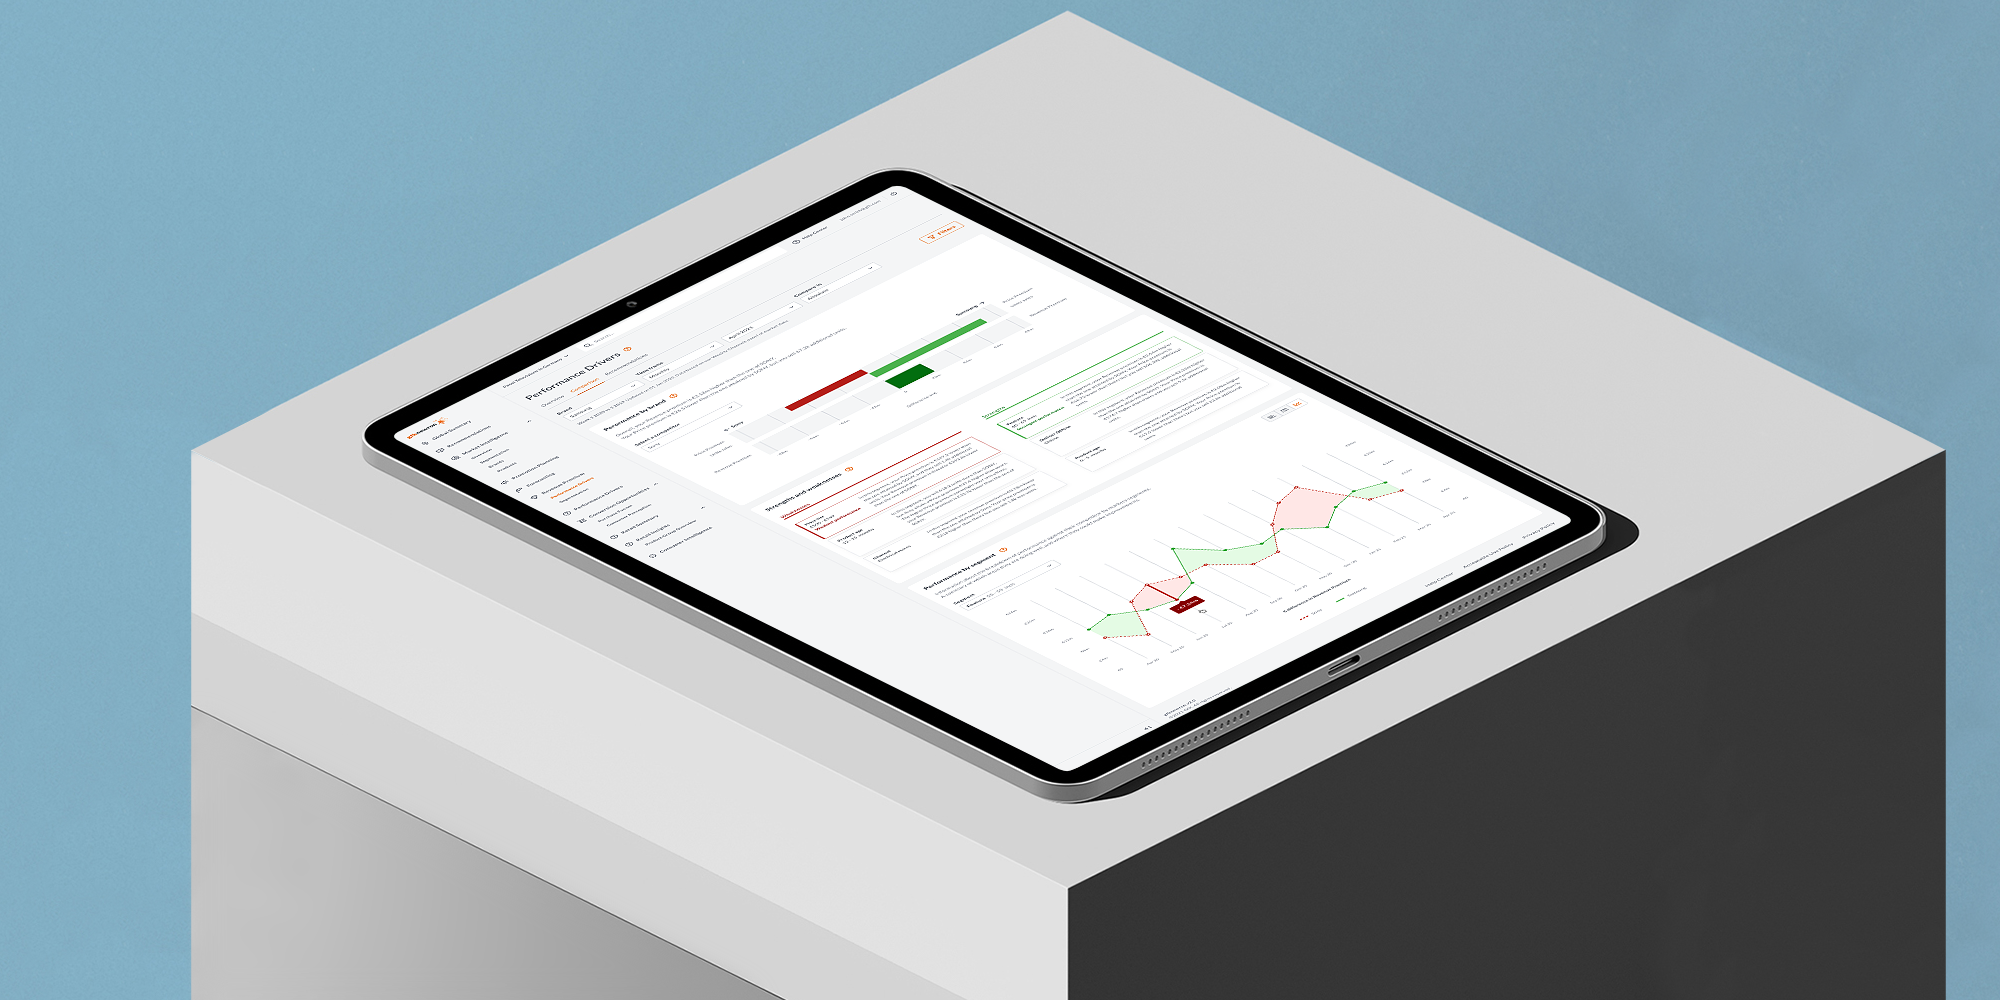
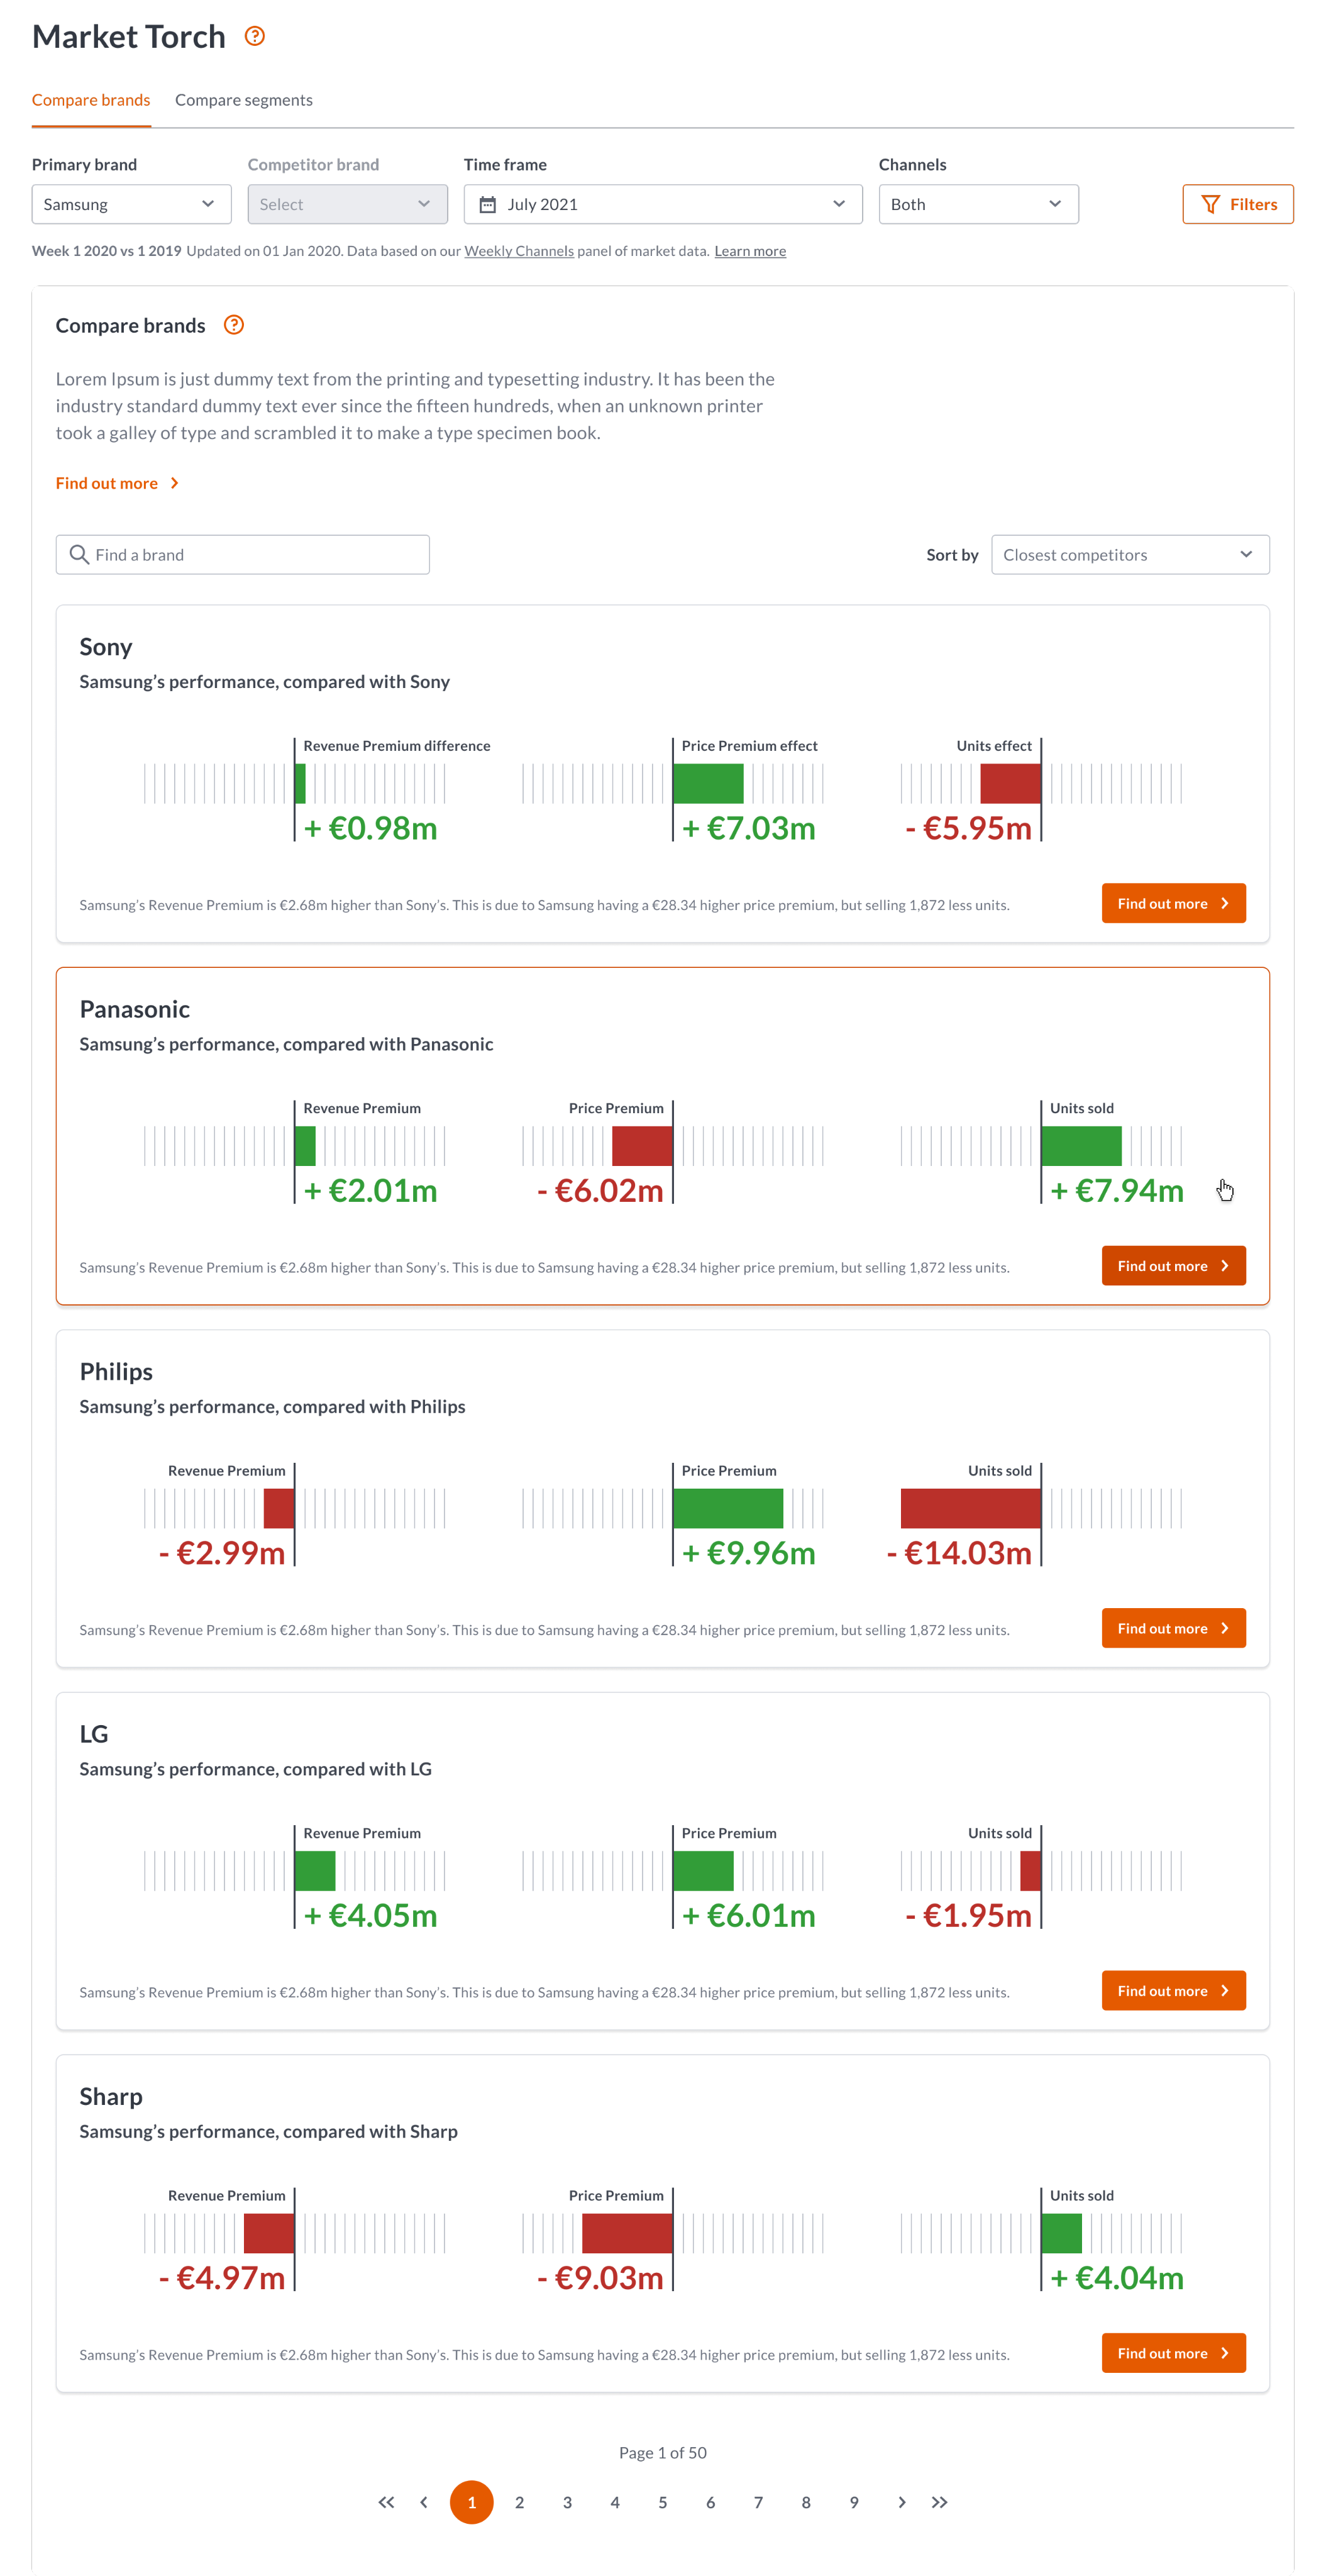
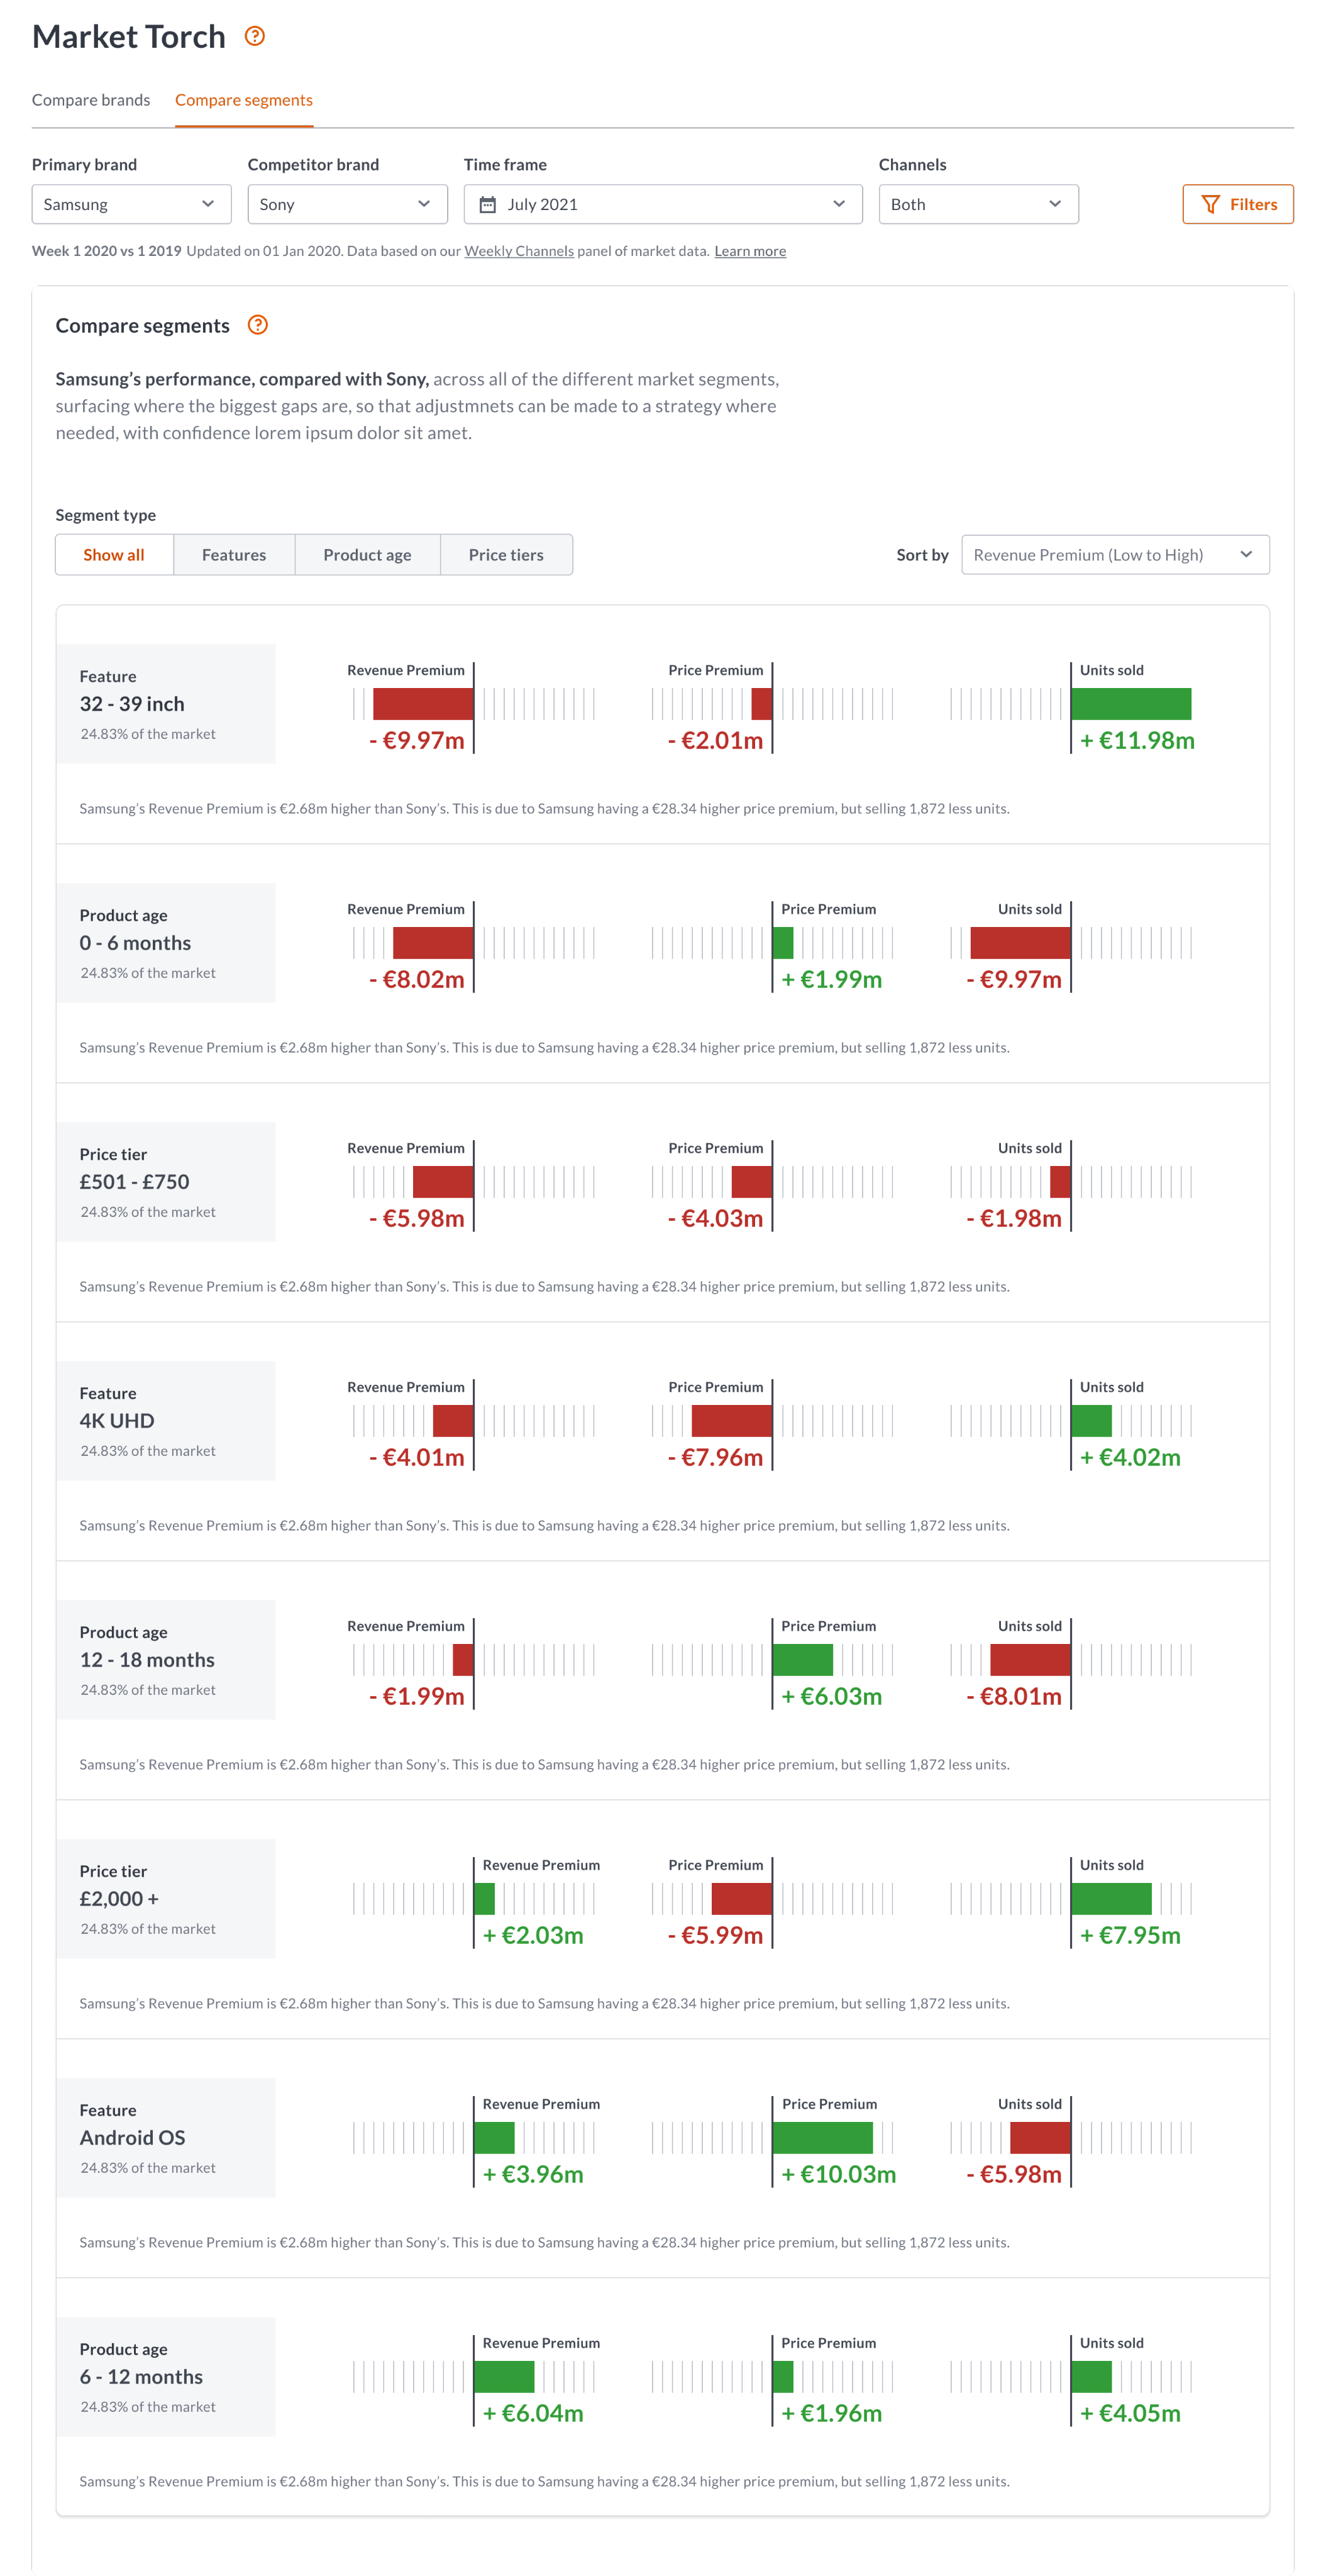
I was hired to work on a new metric created by the in-house data scientists, called Revenue Premium. This metric combines two other metrics; Price Premium, and Unit Sales. Price Premium is the premium amount a consumer is prepared to pay for your brand, above that of your competitors.
Within Revenue Premium you then have Market Torch, which is effectively a breakdown of your overall score in
to segments, like television screen sizes or price brackets. You can then compare your metrics with your competitors to see where you are strong, and where you can make improvements.
About
Background
- Brands design, manufacture, and sell their products in multiple markets.
- A market is a product category, and region.
- Each product category has its own market segments, such a screen sizes or display technology.
- A brand wants to measure its performance at a brand level, product level, and segment level.
- They measure their performance using multiple metrics.
- They also want to compare themselves against other brands.
Market Torch
I was hired to work on a new metric created by the in-house data scientists, called Revenue Premium. This metric combines two other metrics; Price Premium, and Unit Sales. Price Premium is the premium amount a consumer is prepared to pay for your brand, above that of your competitors.
Within Revenue Premium you then have Market Torch, which is effectively a breakdown of your overall score in
to segments, like television screen sizes or price brackets. You can then compare your metrics with your competitors to see where you are strong, and where you can make improvements.
Example
Two brands may have a similar revenue premium score, similar unit sales and similar price premium, but one brand may be performing well in the high end market (65+ inch £1,000+) where the other brand may be doing well in the low end market (0-32 inch under £300)
Market Torch surfaces where the biggest gaps are, and enables the user to confidently adjust their marketing or manufacturing strategy.
Data science
I was hired to work on a new metric created by the in-house data scientists, called Revenue Premium. This metric combines two other metrics; Price Premium, and Unit Sales. Price Premium is the premium amount a consumer is prepared to pay for your brand, above that of your competitors.
Within Revenue Premium you then have Market Torch, which is effectively a breakdown of your overall score in
to segments, like television screen sizes or price brackets. You can then compare your metrics with your competitors to see where you are strong, and where you can make improvements.
Exploration
We carried out a number of team activities where we explored the concept, and generated new ideas.
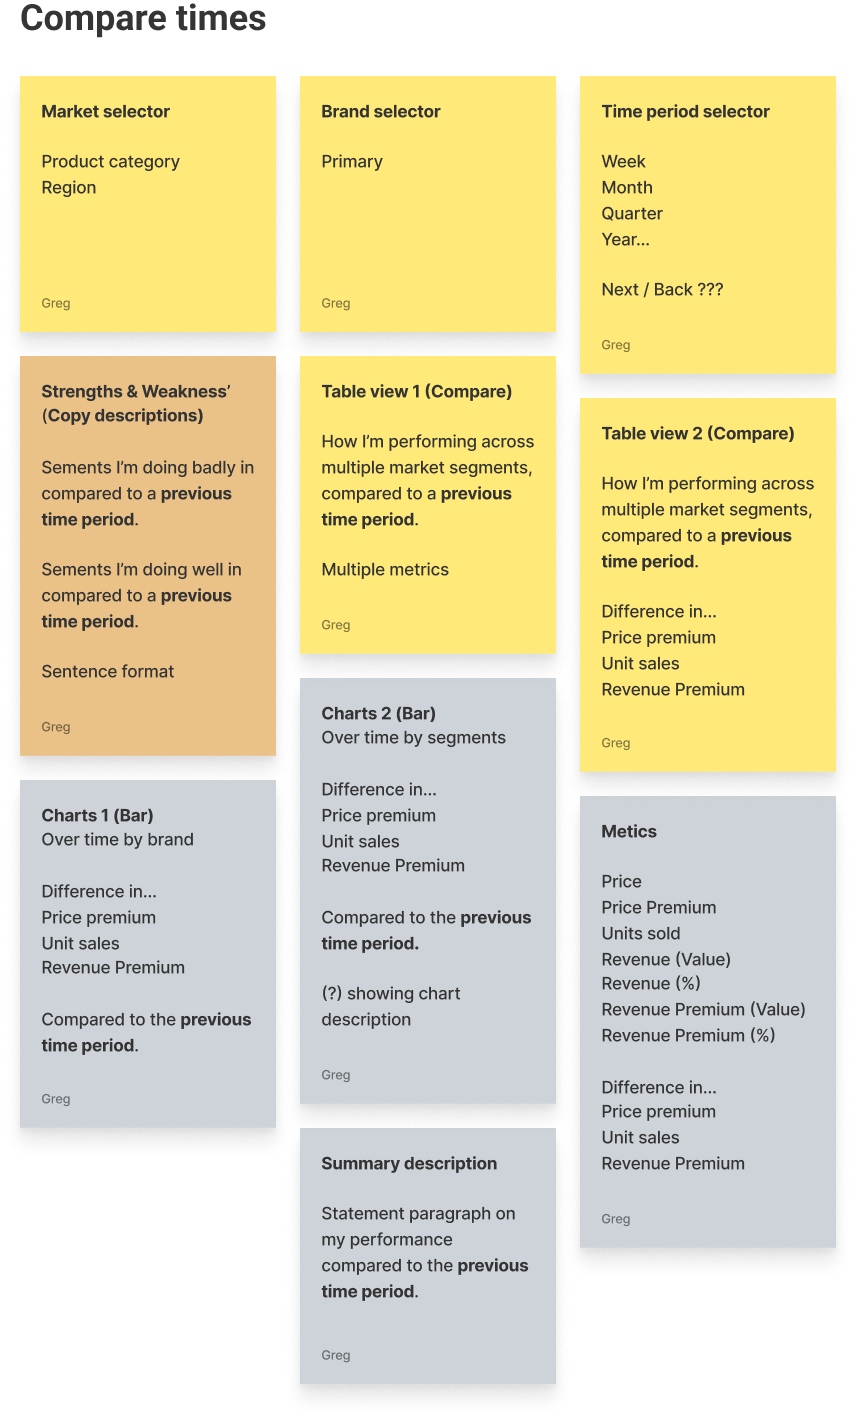
What we might need
We listed out what we might need from a features and functionality perspective.
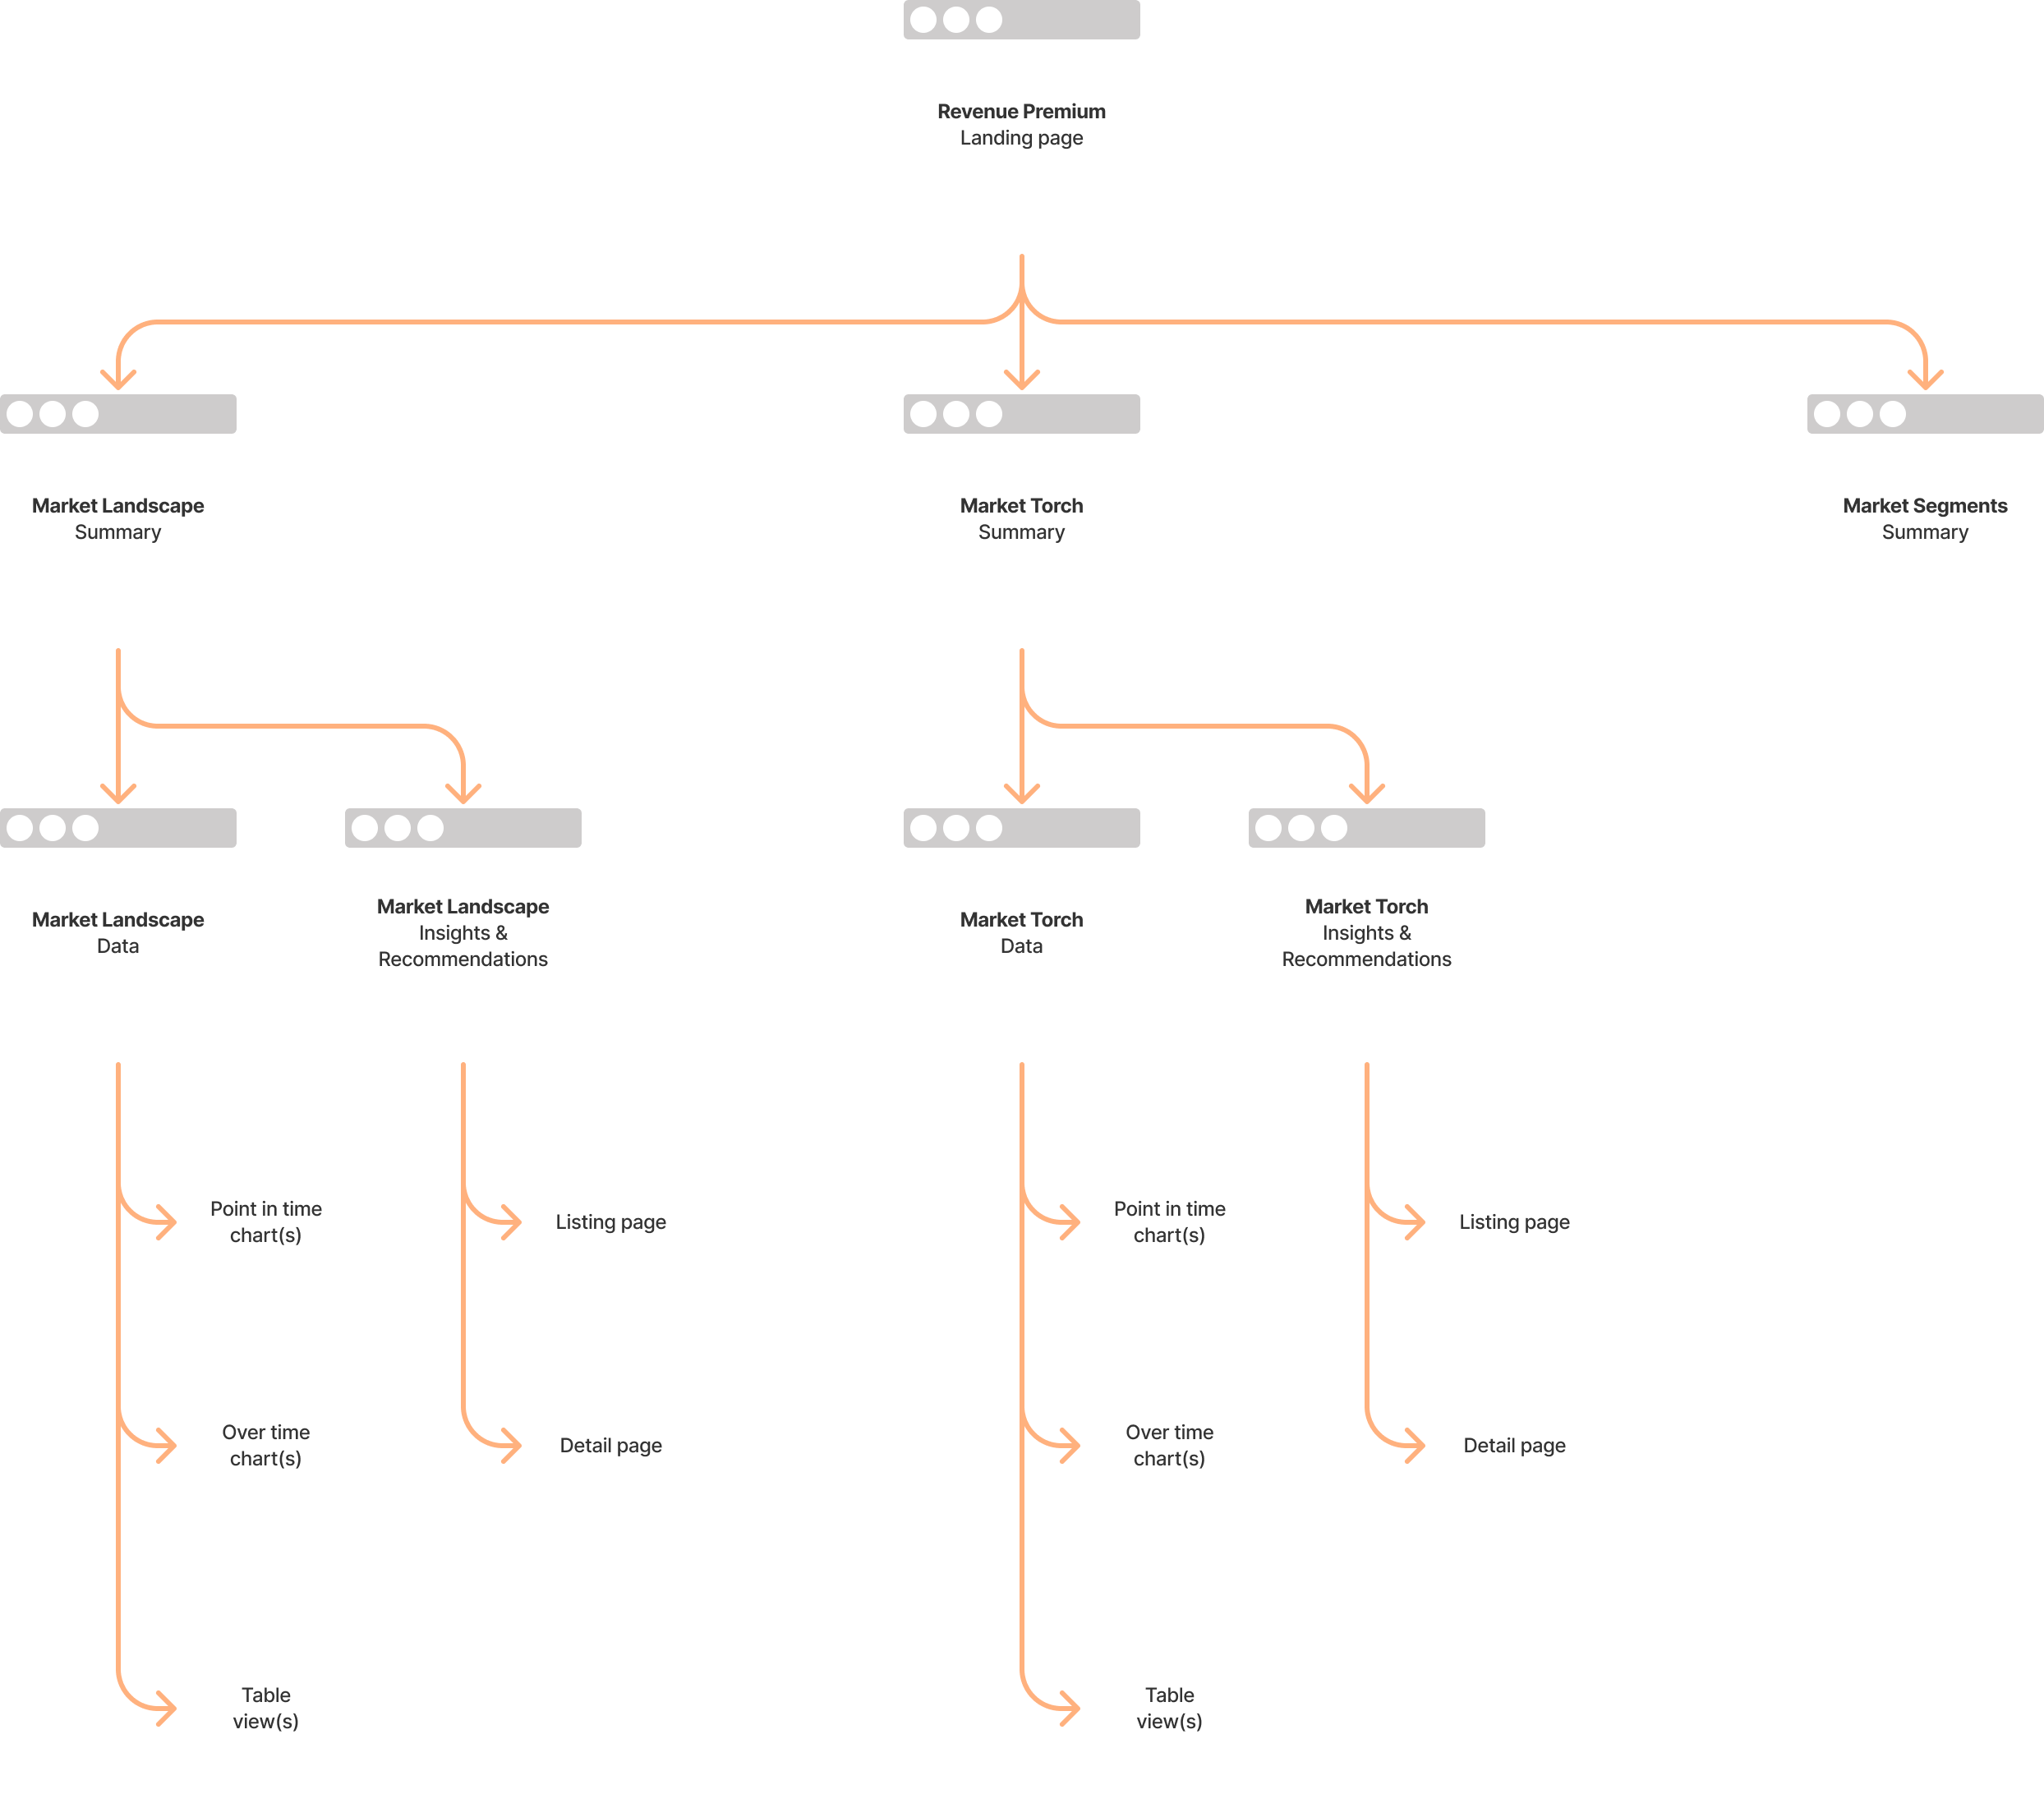
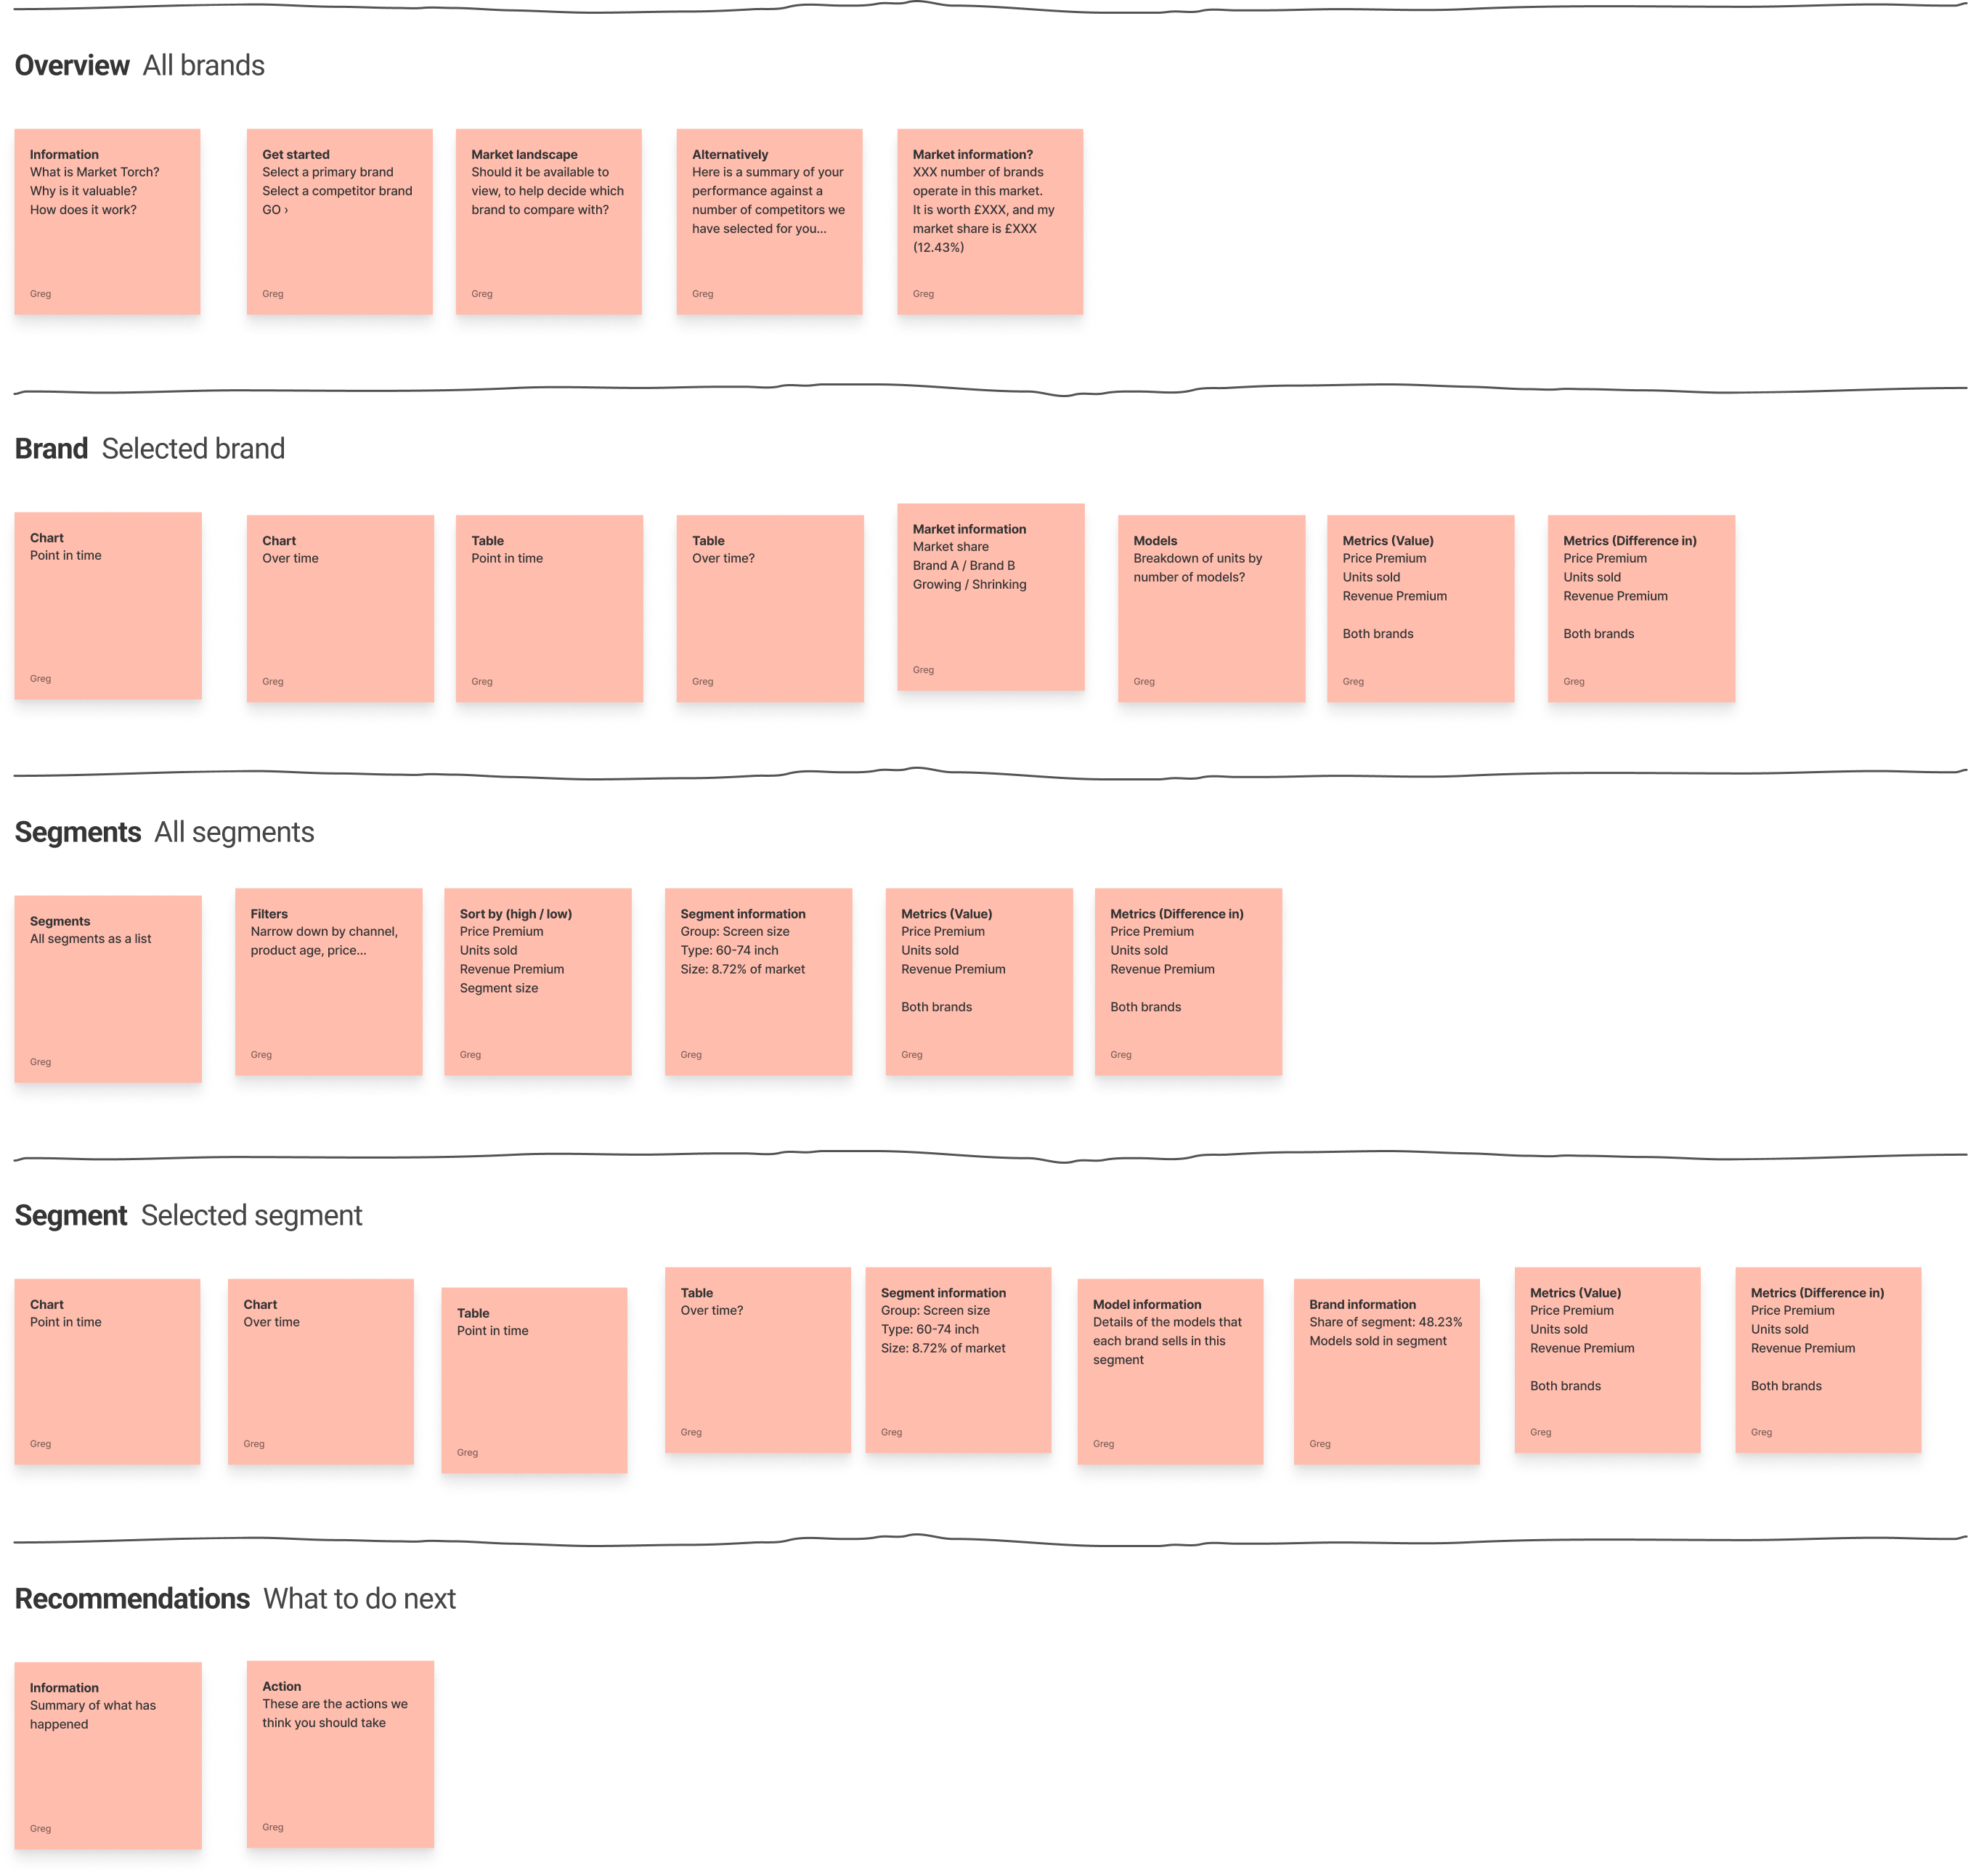
How it might be structured
We put together a mini sitemap of how it might be structured.
MVP
We then agreed on what the MVP should be.
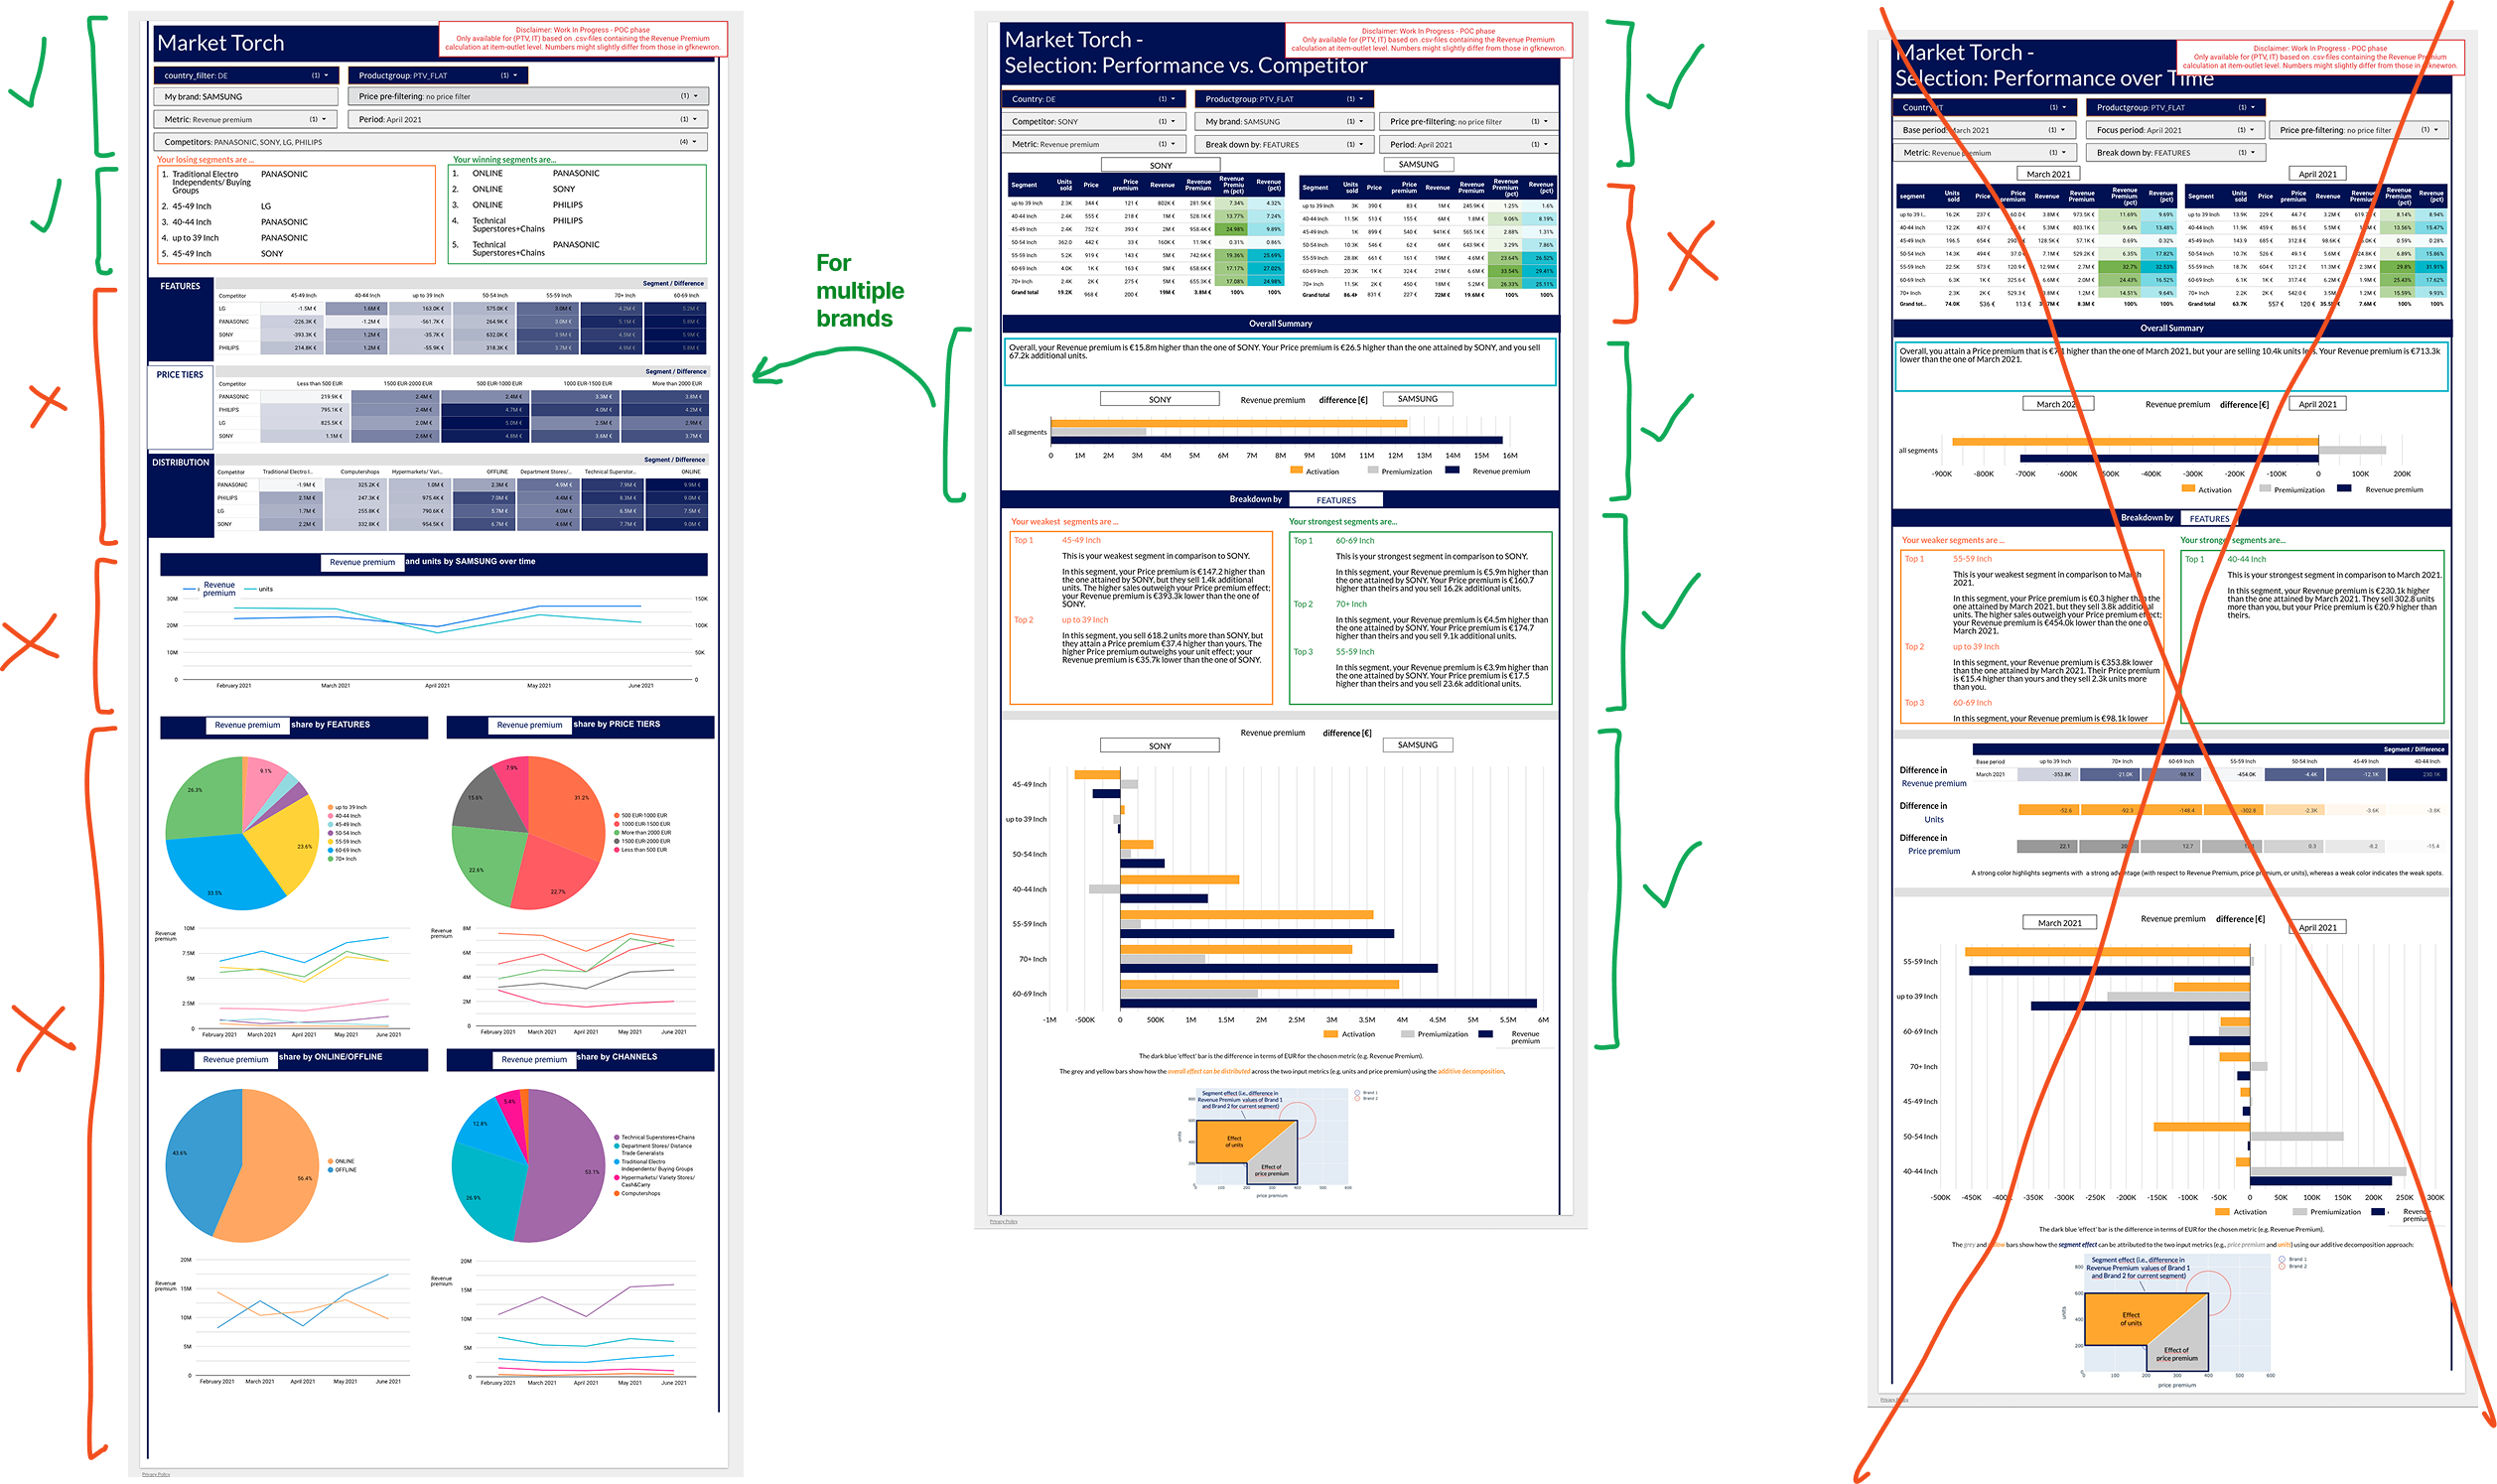

What we showed
Next came the challenging bit. A design system had already been created up-front, which was quite dry and rigid.
This meant that there wasn’t a lot of freedom or flexibility when it came to designing the screens for user testing.


What we used
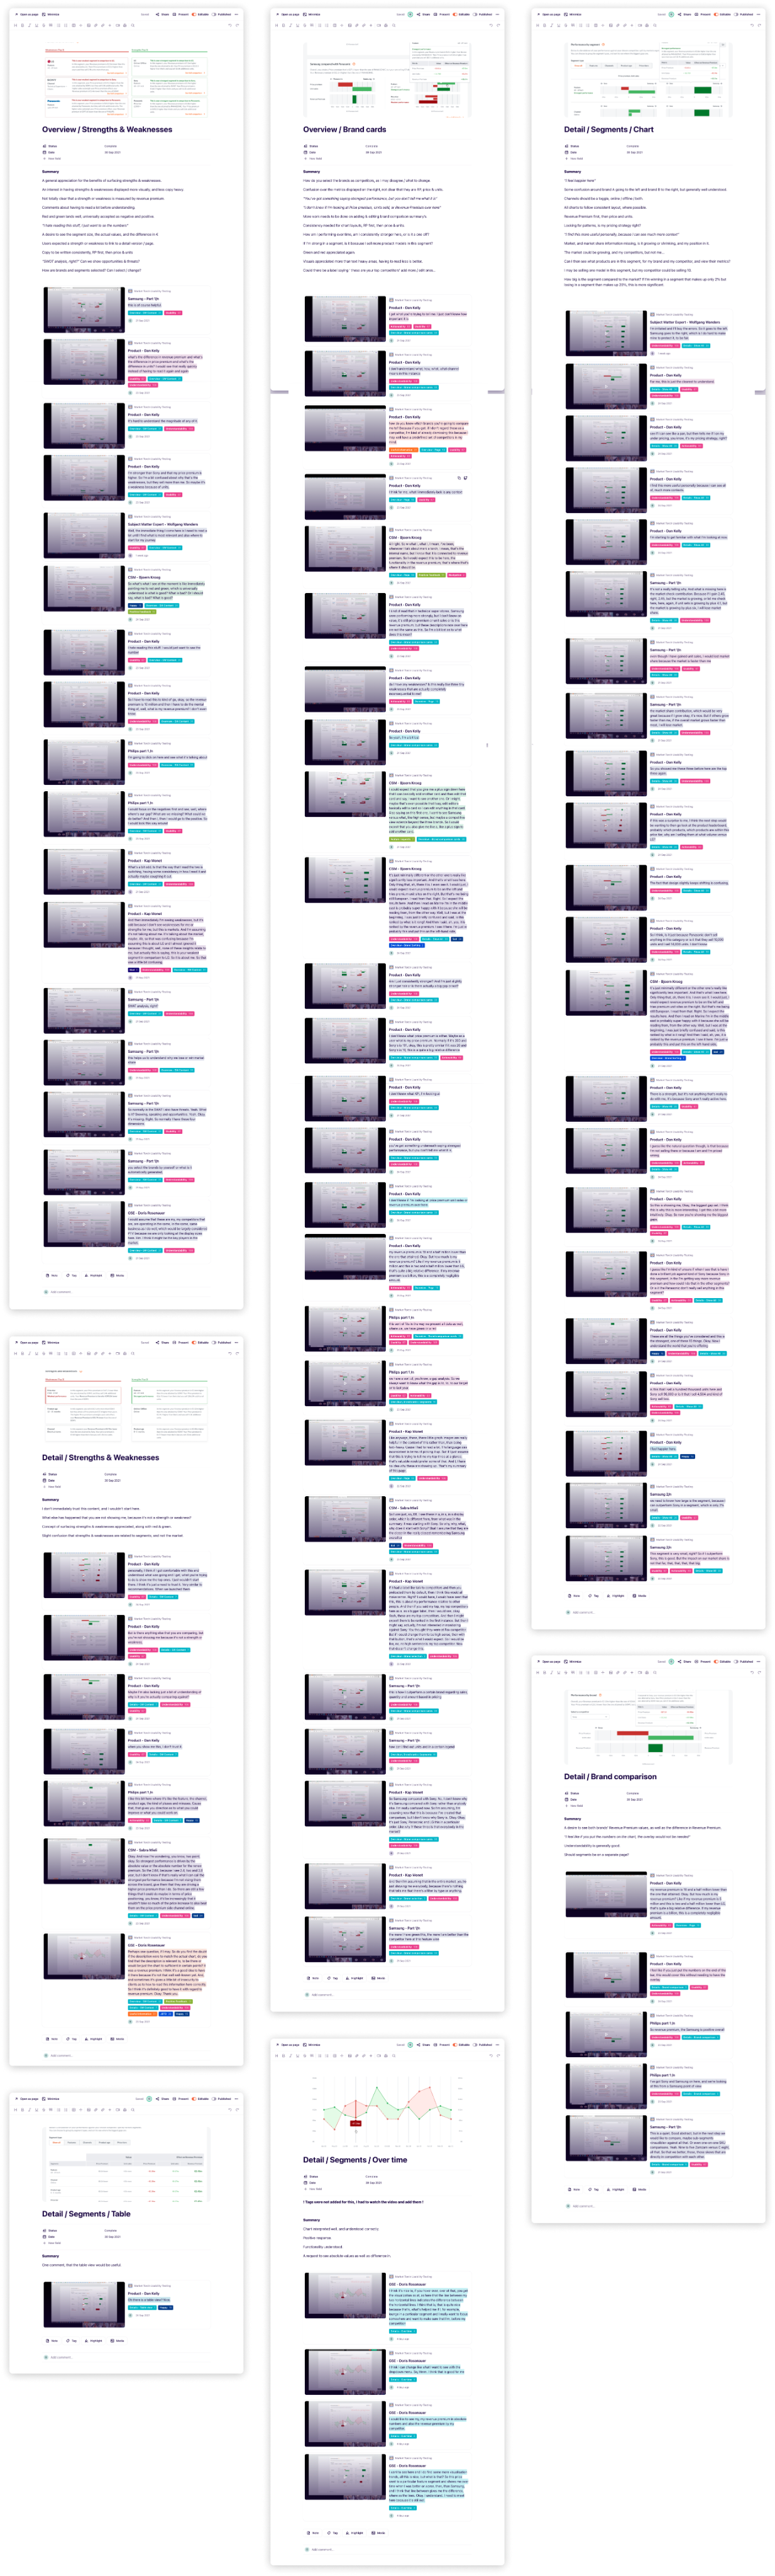
We used Dovetail for all of our user testing, uploading videos, creating tags, and applying them to the transcripts.
Our insights
Our insights were then generated for all of the different features and functionality parts that we tested.
These were then shared with the wider team, data scientists, and stakeholders.
Topics for discussion
We then re-grouped , and listed out all of our questions and ideas for our next iteration.
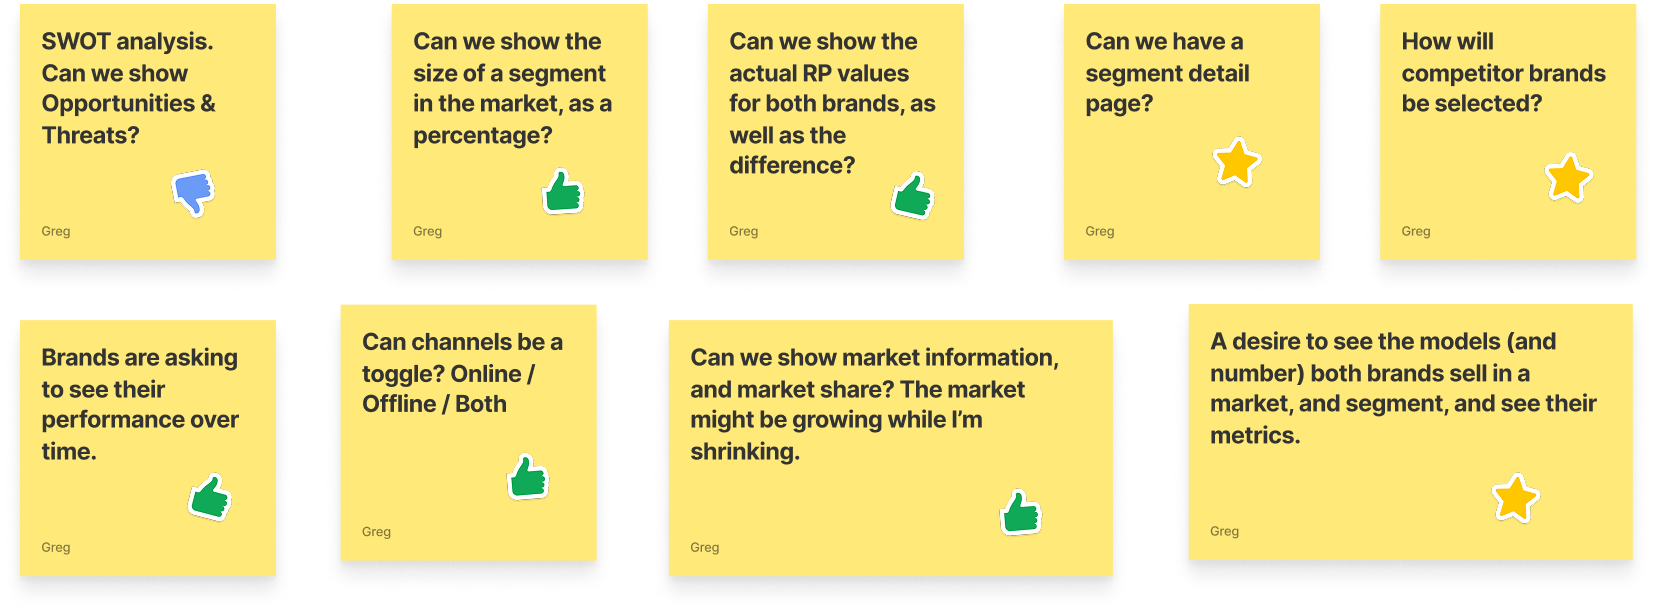
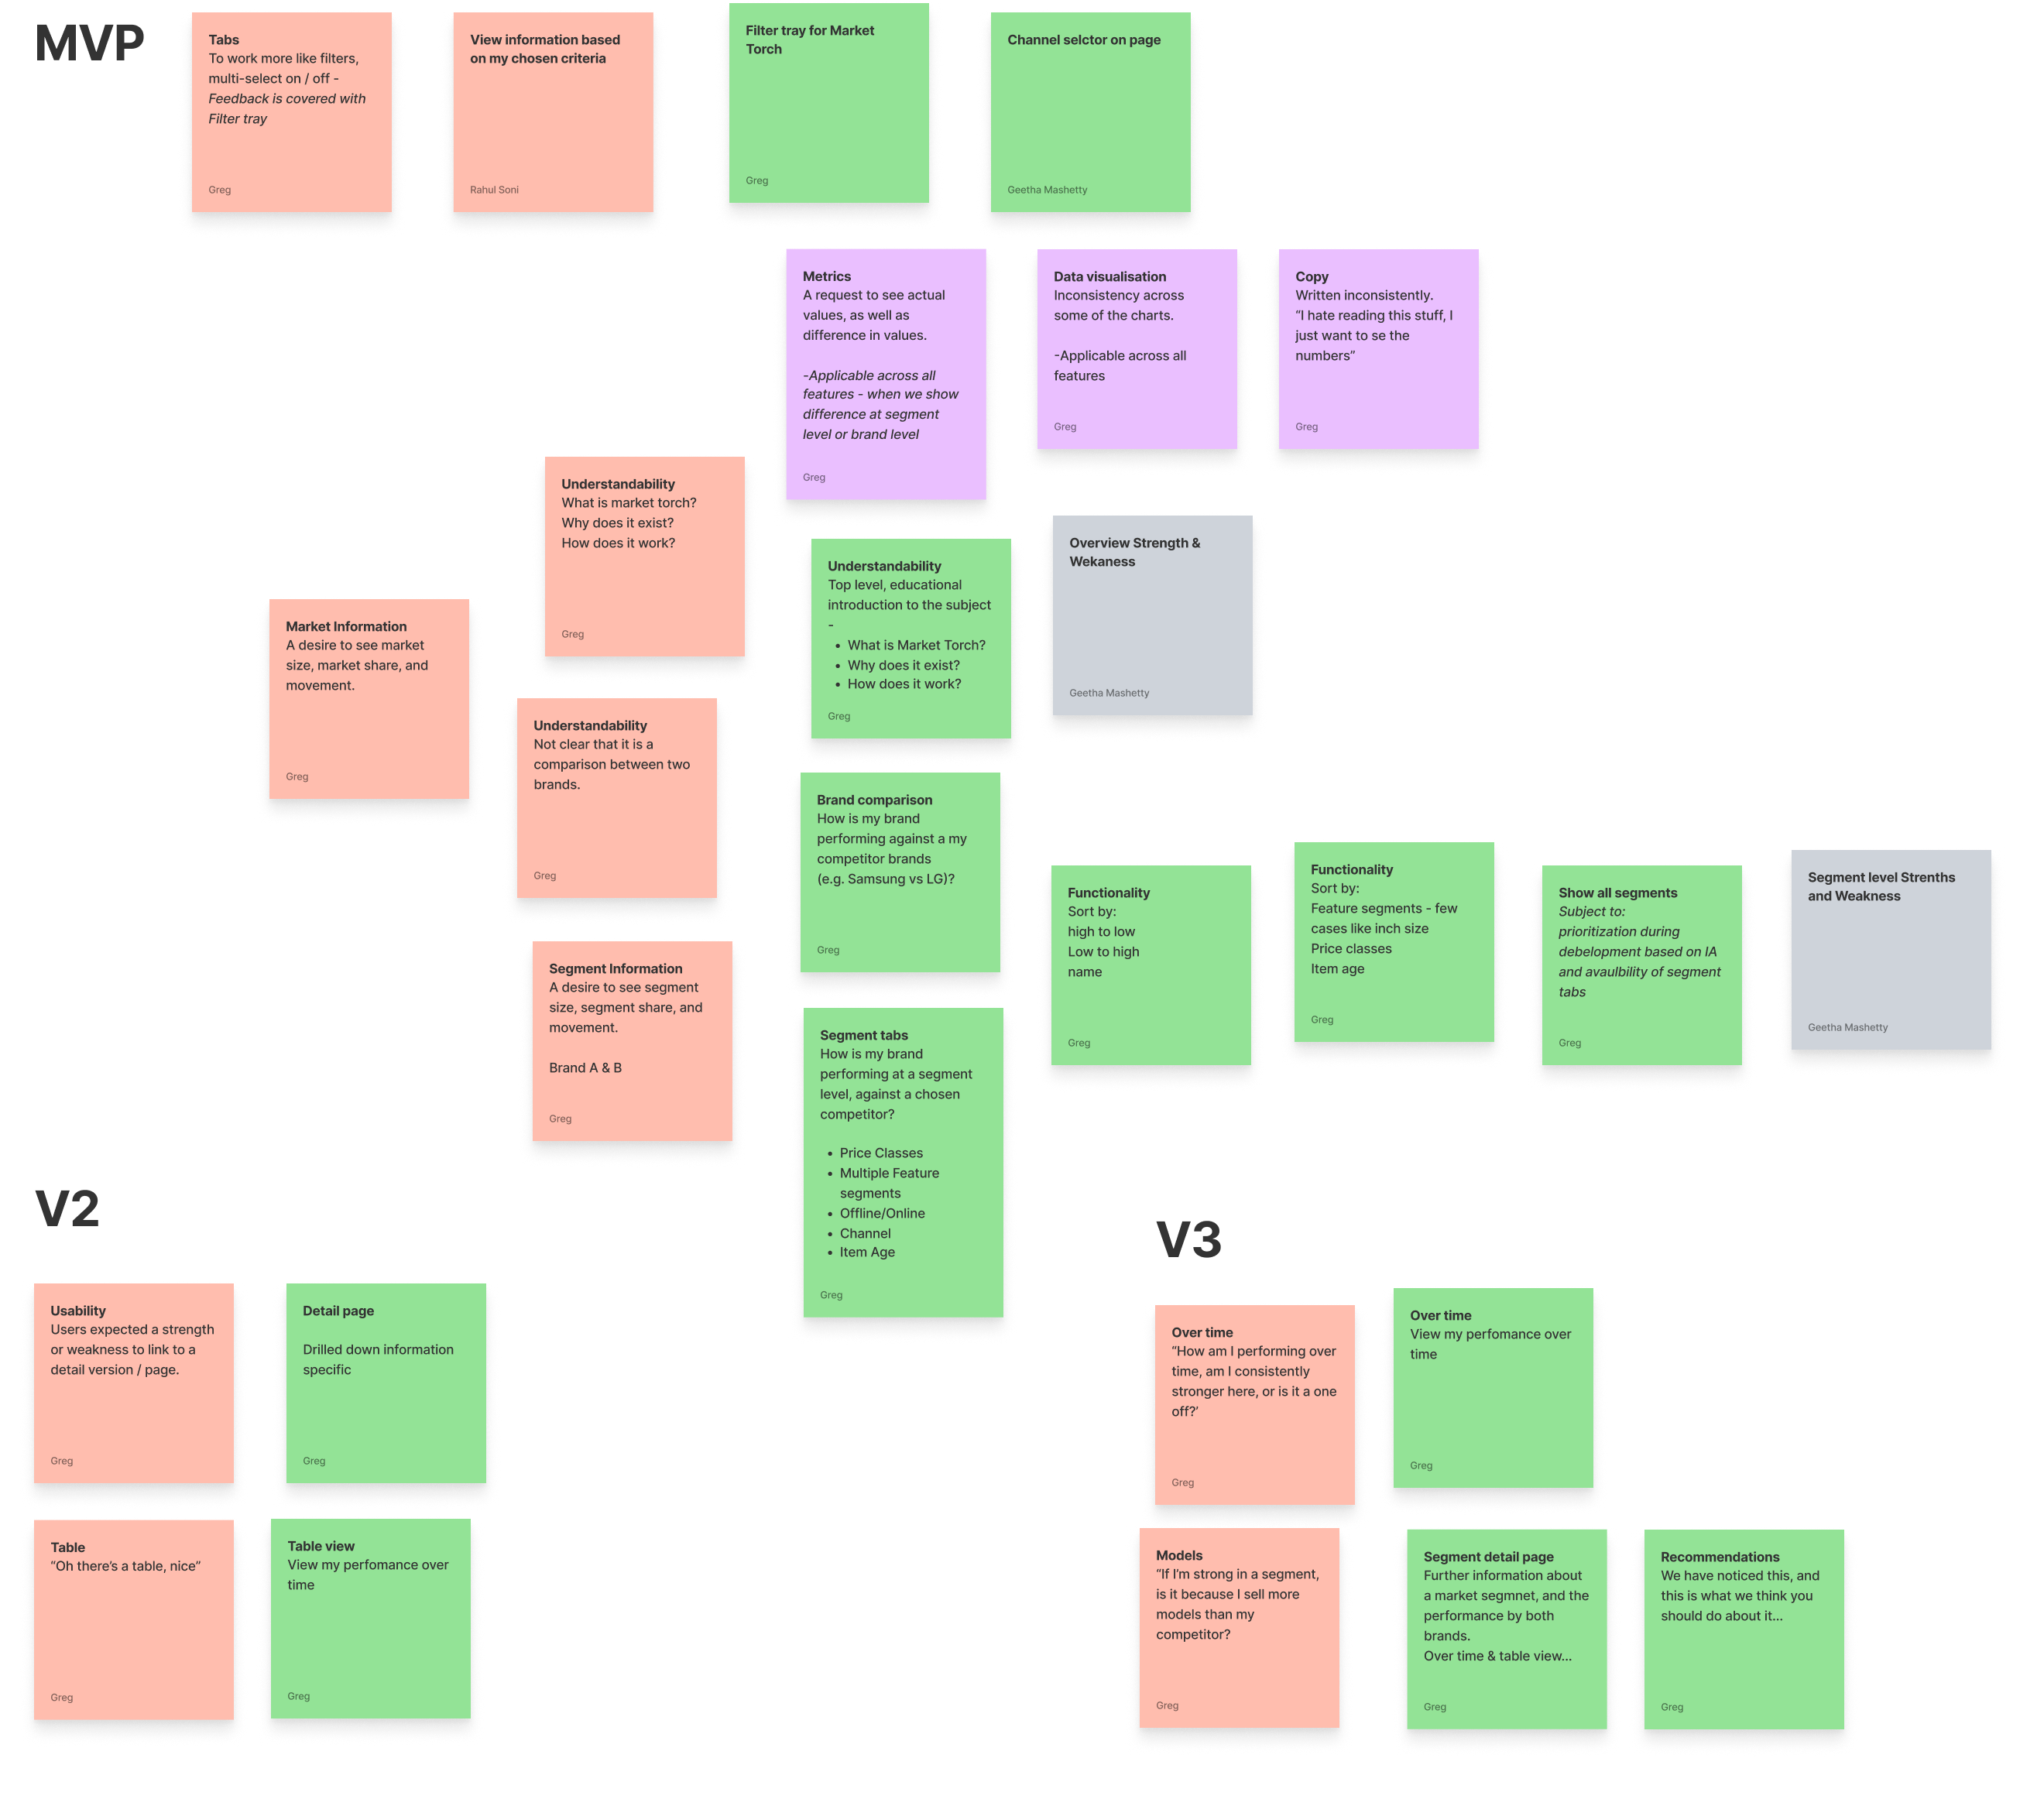
Ideas for the next iteration
Based on the insights generated
Prioritisation
Next, we prioritised what should be in the next MVP iteration, and what could move to a version two or three.
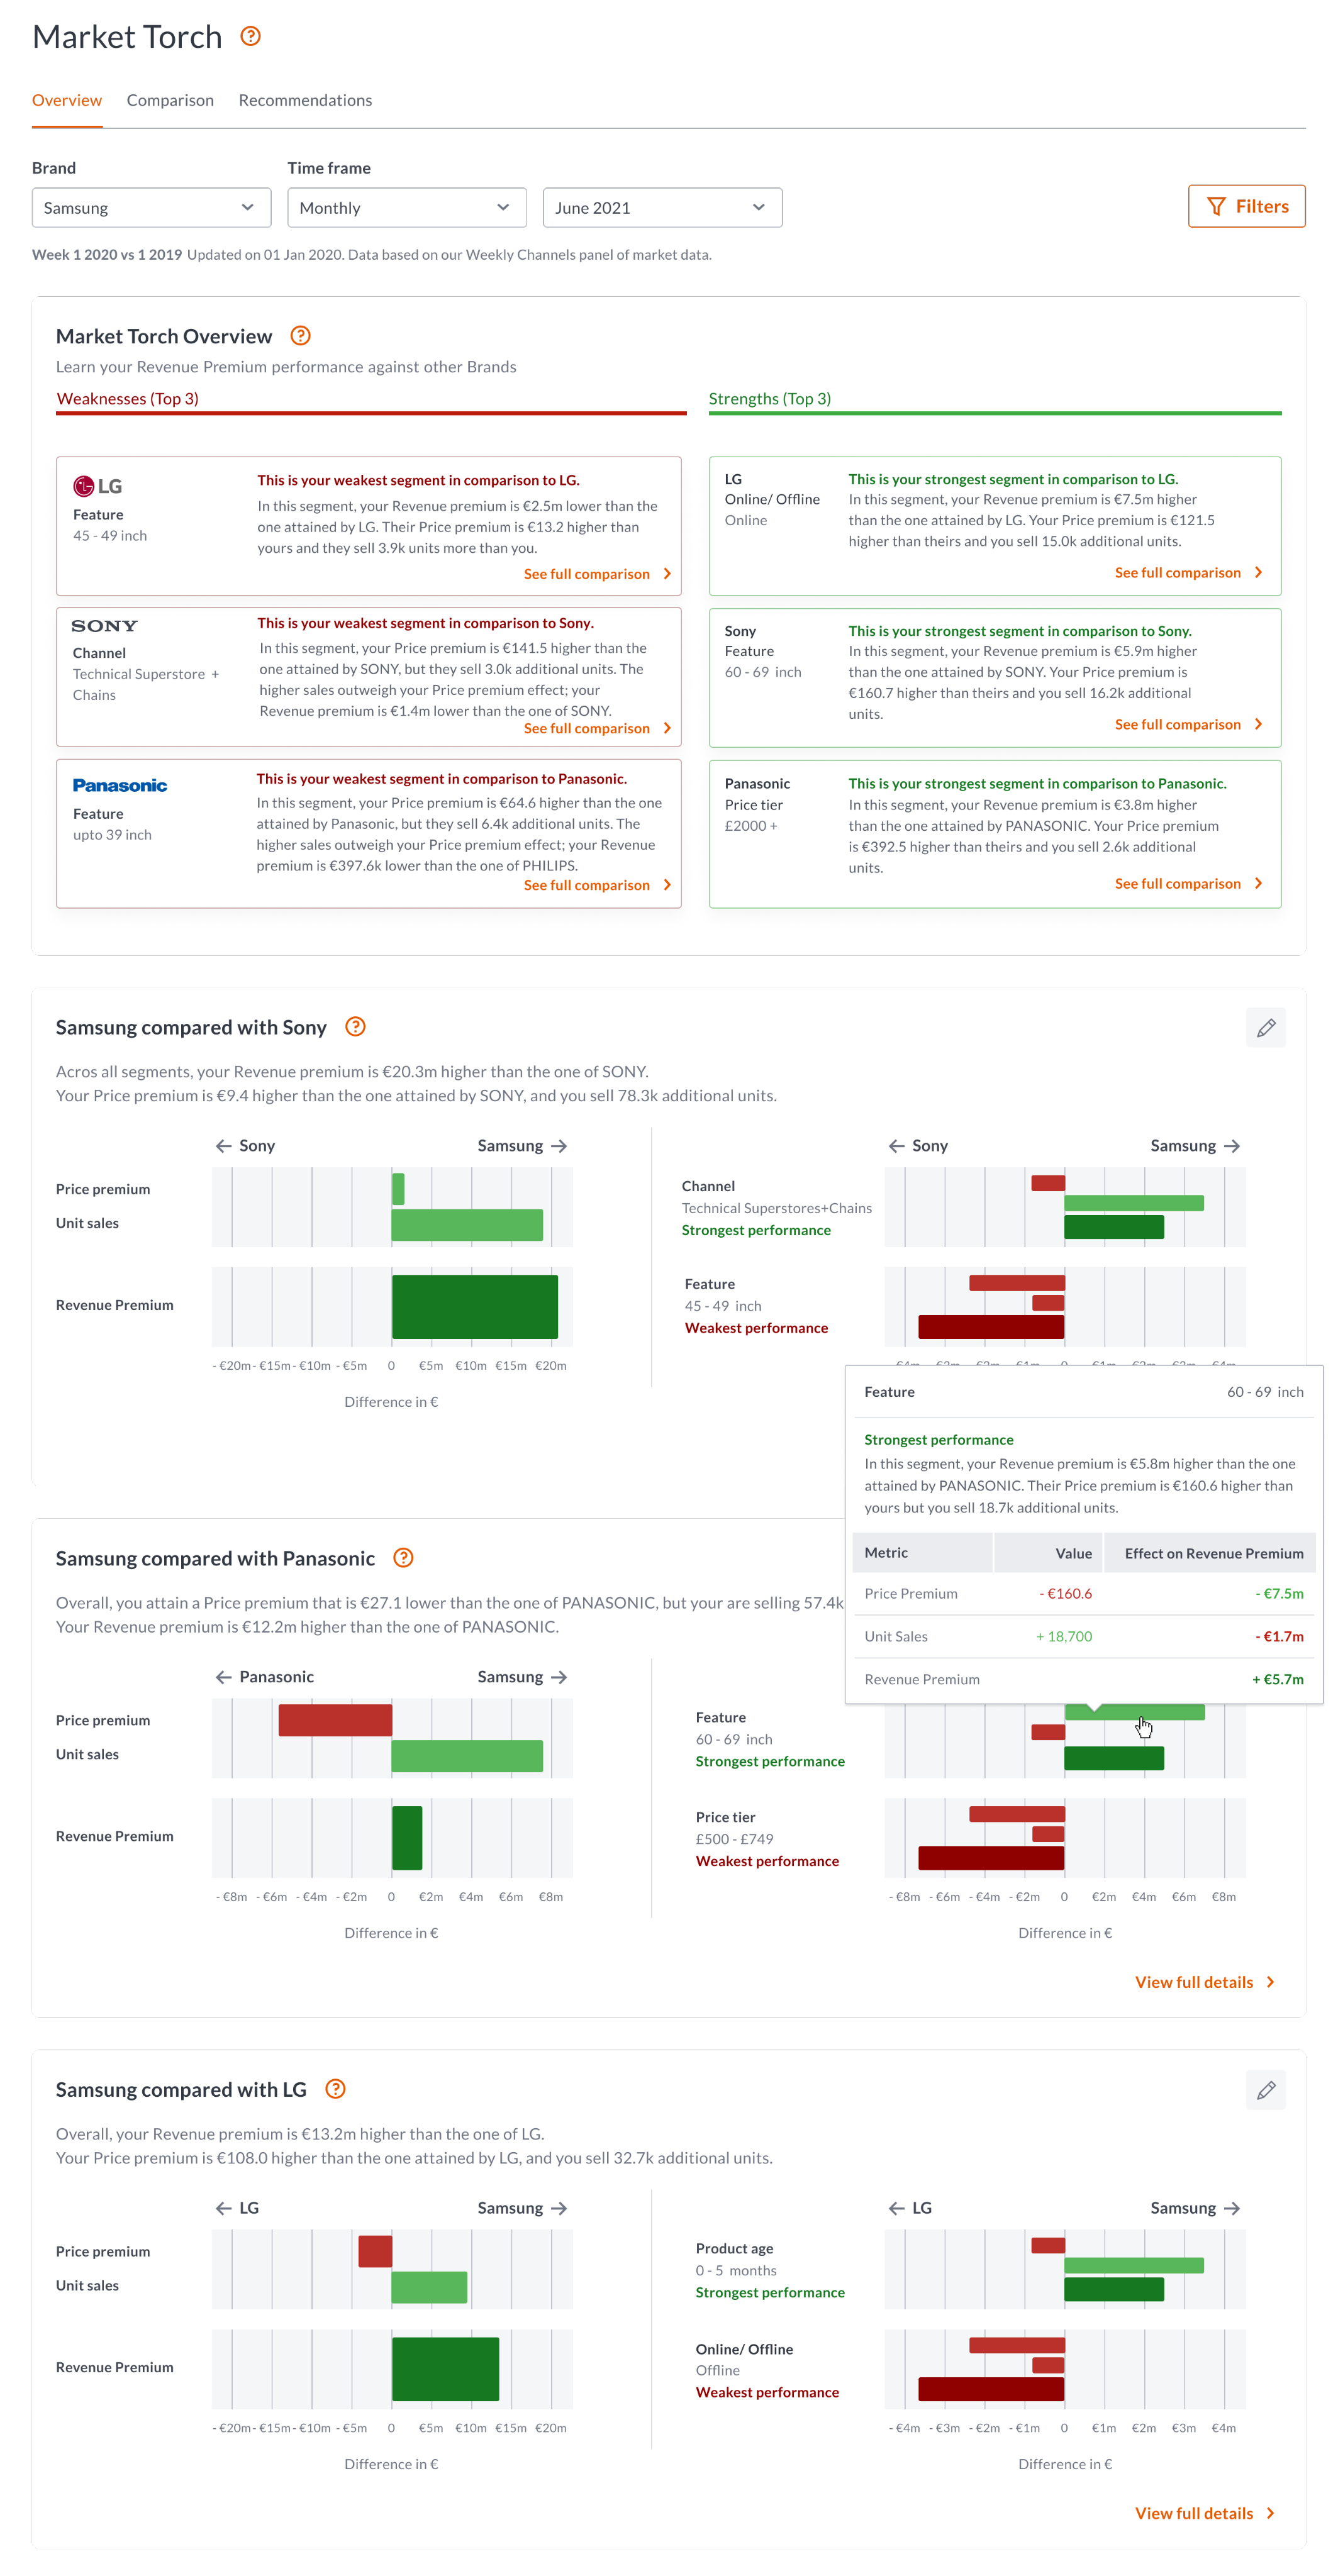
Next MVP iteration
We then created our next iteration ready for user testing again.

At this point
We then shared our modified designs with the data scientists. The designs were an immediate response to the user feedback that we had captured and shared, but the updated designs were now quite different from the original data scientist creations.
Internal feedback
We received a tidal wave of internal feed back from the data scientists.
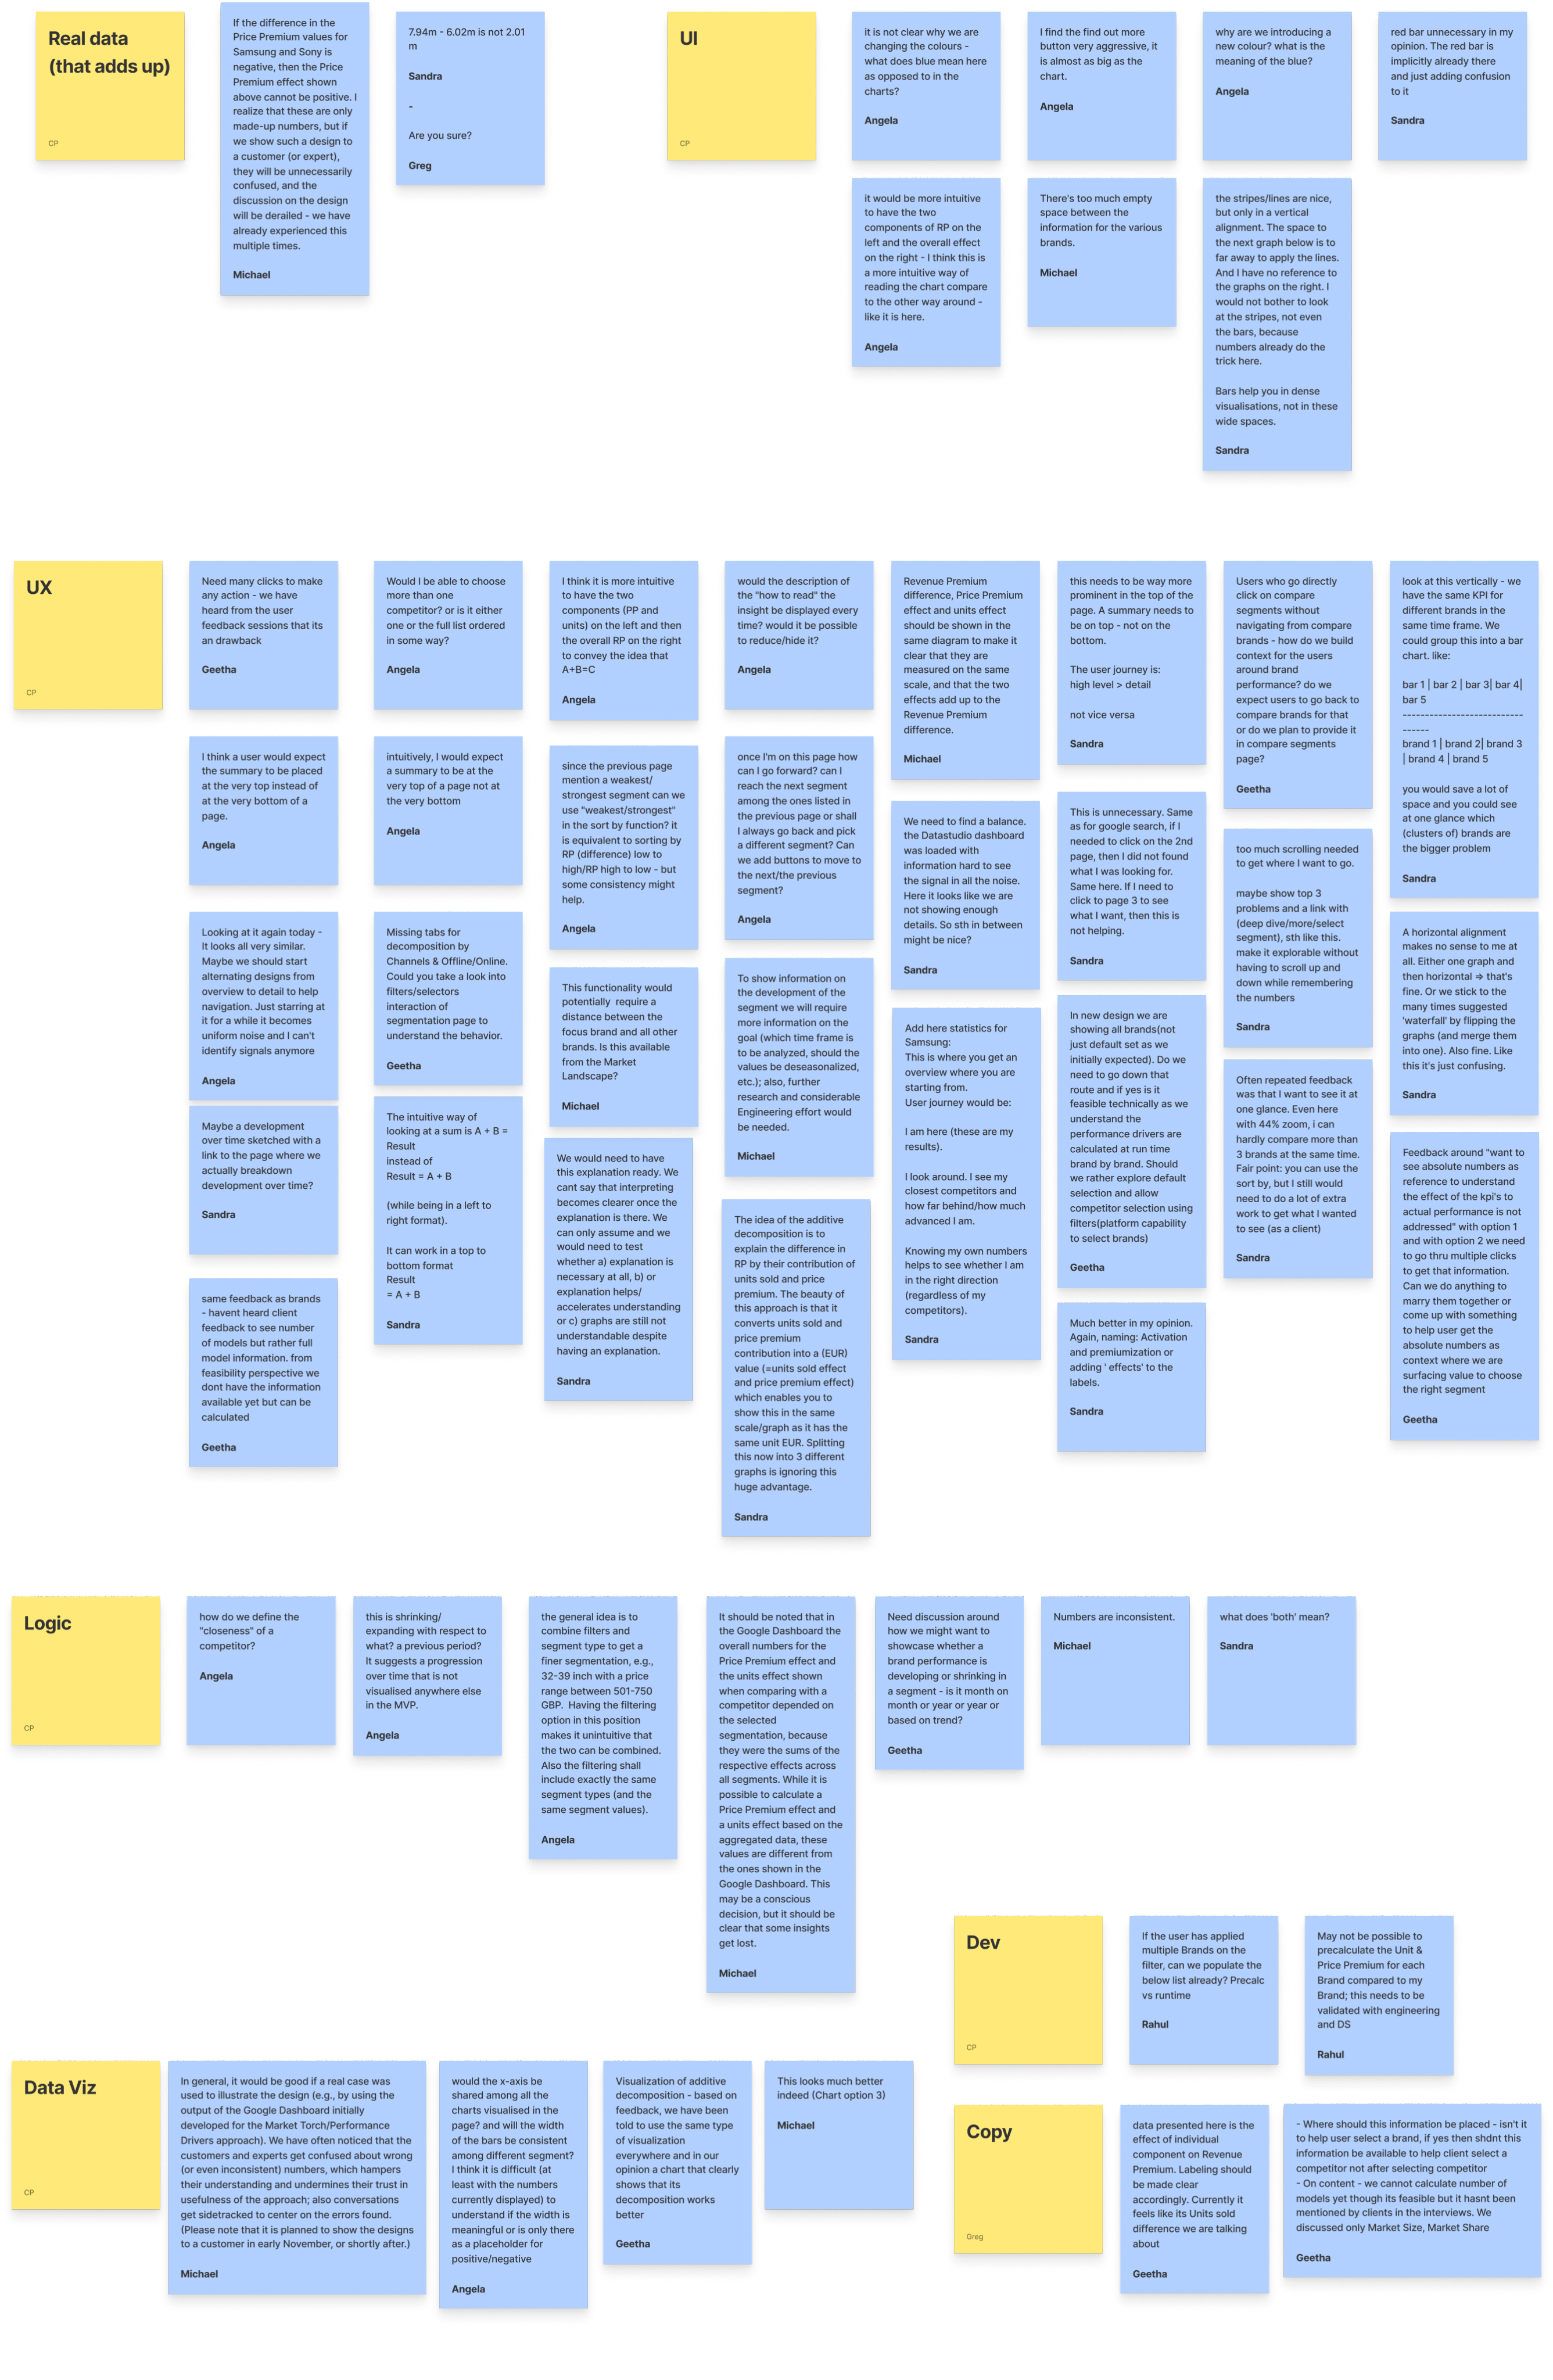
Next steps
It became clear that the data scientists were very opinionated, and disagreed with the feedback from our users, and our response to it. We needed to get them back on-side, and not be fighting against them, so we decided to take a step back, and bring them along the journey with us.
We went back in to wireframe mode, creating a set of components first, and then we went through the original designs, and the user feedback together.
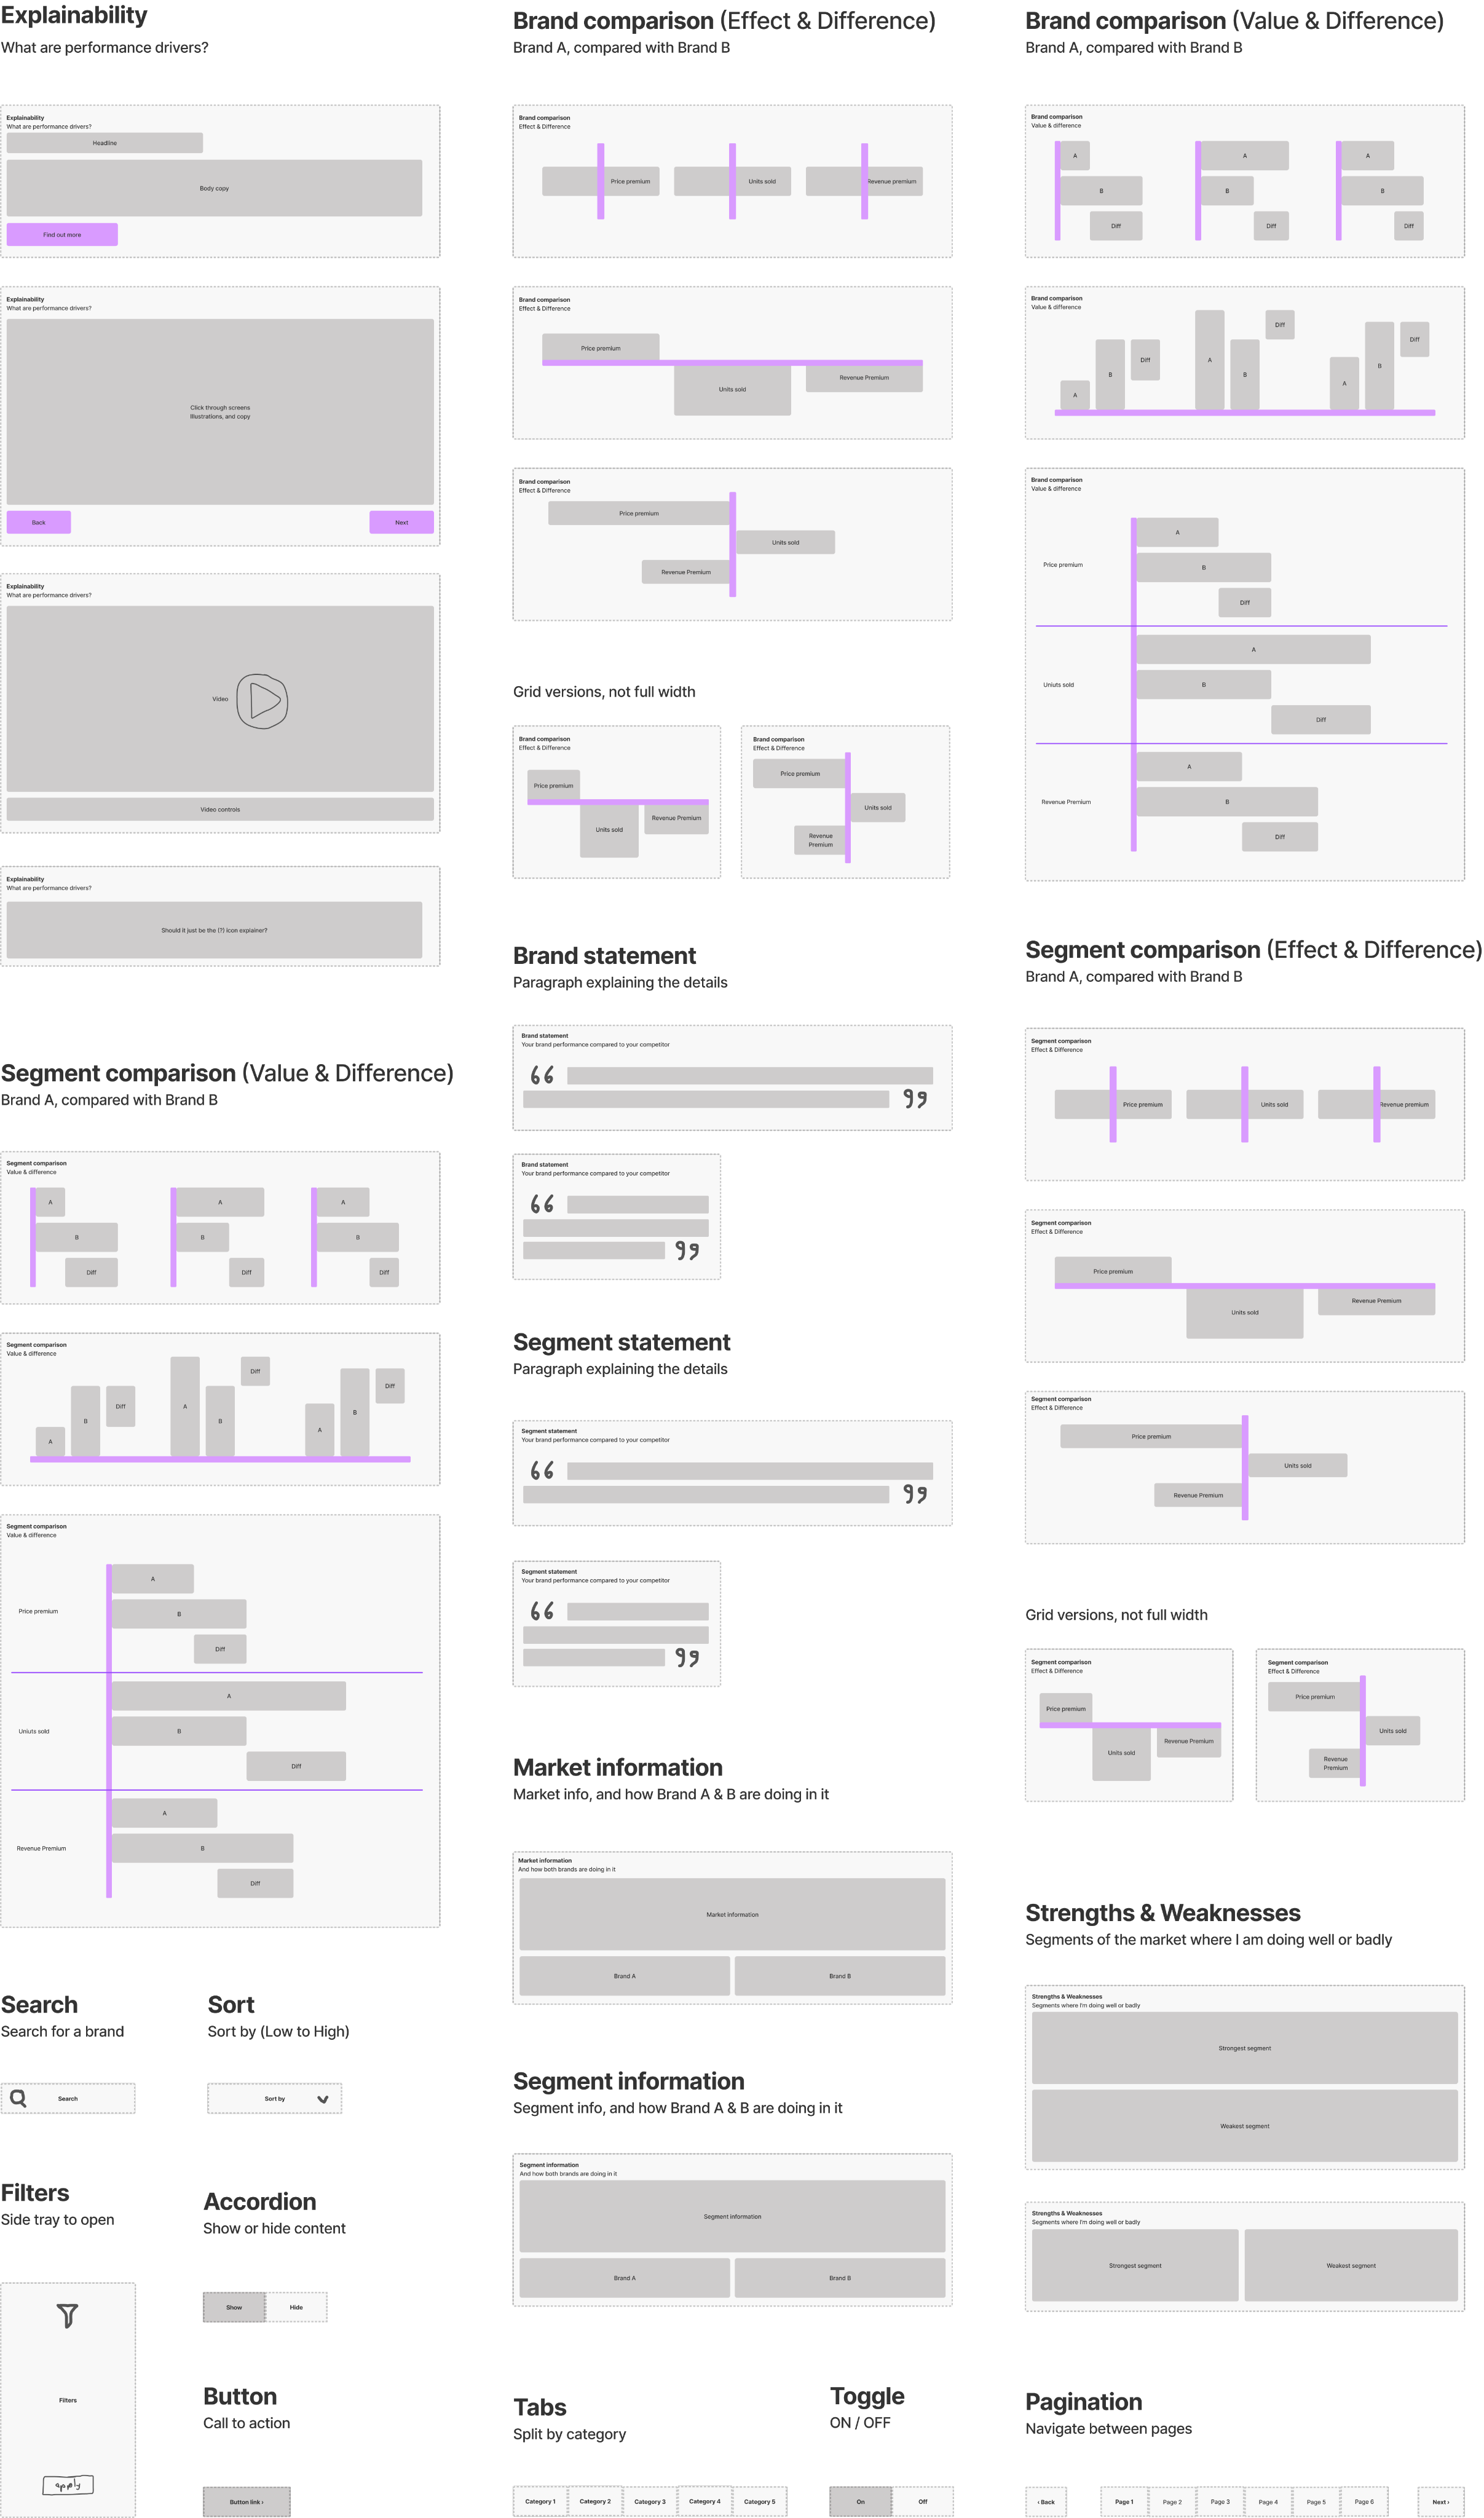
The outcome
We used the components as jigsaw pieces to create a response to the user feedback collectively, each one of us sharing our thoughts and ideas throughout the process.
Finally
We re-applied the design system UI, tested the designs again, and synthesised the user feedback.
We then prioritised the changes, made them, and then moved to engineering.
Summary
This project had many challenges along the way, it was not as simple as reusing a tried and tested process, we had to constantly adapt to changing circumstances throughout the project.
It was a data heavy project with a lot to learn and understand from the start, and a carful balancing act between what was right for the business, and what was right for the end user.
The design system that was already in place was weak, and this caused a few usability problems, but we got to a good place in the end, where a new metric could be brought to market, offering a new in-depth and detailed insight in to a brands performance across many segments.

Industry
Insights
Product
SaaS Platform
GFK
GFK are the largest market research company in Germany, and the fourth largest in the world. They provide data and intelligence to the consumer goods industry, enabling brands to compare their own market performance, with that of their competitors.
I joined them during a digital transformation phase, where they were preparing the company for a takeover.
Overview
I was hired to work on a new metric created by the in-house data scientists, called Revenue Premium. This metric combines two other metrics; Price Premium, and Unit Sales. Price Premium is the premium amount a consumer is prepared to pay for your brand, above that of your competitors.
Within Revenue Premium you then have Market Torch, which is effectively a breakdown of your overall score in
to segments, like television screen sizes or price brackets. You can then compare your metrics with your competitors to see where you are strong, and where you can make improvements.
About
Background
- Brands design, manufacture, and sell their products in multiple markets.
- A market is a product category, and region.
- Each product category has its own market segments, such a screen sizes or display technology.
- A brand wants to measure its performance at a brand level, product level, and segment level.
- They measure their performance using multiple metrics.
- They also want to compare themselves against other brands.
Market Torch
I was hired to work on a new metric created by the in-house data scientists, called Revenue Premium. This metric combines two other metrics; Price Premium, and Unit Sales. Price Premium is the premium amount a consumer is prepared to pay for your brand, above that of your competitors.
Within Revenue Premium you then have Market Torch, which is effectively a breakdown of your overall score in
to segments, like television screen sizes or price brackets. You can then compare your metrics with your competitors to see where you are strong, and where you can make improvements.
Example
Two brands may have a similar revenue premium score, similar unit sales and similar price premium, but one brand may be performing well in the high end market (65+ inch £1,000+) where the other brand may be doing well in the low end market (0-32 inch under £300)
Market Torch surfaces where the biggest gaps are, and enables the user to confidently adjust their marketing or manufacturing strategy.
Data science
I was hired to work on a new metric created by the in-house data scientists, called Revenue Premium. This metric combines two other metrics; Price Premium, and Unit Sales. Price Premium is the premium amount a consumer is prepared to pay for your brand, above that of your competitors.
Within Revenue Premium you then have Market Torch, which is effectively a breakdown of your overall score in
to segments, like television screen sizes or price brackets. You can then compare your metrics with your competitors to see where you are strong, and where you can make improvements.
Exploration
We carried out a number of team activities where we explored the concept, and generated new ideas.
What we might need
We listed out what we might need from a features and functionality perspective.
How it might be structured
We put together a mini sitemap of how it might be structured.
MVP
We then agreed on what the MVP should be.
What we showed
Next came the challenging bit. A design system had already been created up-front, which was quite dry and rigid.
This meant that there wasn’t a lot of freedom or flexibility when it came to designing the screens for user testing.


What we used
We used Dovetail for all of our user testing, uploading videos, creating tags, and applying them to the transcripts.
Our insights
Our insights were then generated for all of the different features and functionality parts that we tested.
These were then shared with the wider team, data scientists, and stakeholders.
Topics for discussion
We then re-grouped , and listed out all of our questions and ideas for our next iteration.
Ideas for the next iteration
Based on the insights generated
Prioritisation
Next, we prioritised what should be in the next MVP iteration, and what could move to a version two or three.
Next MVP iteration
We then created our next iteration ready for user testing again.

At this point
We then shared our modified designs with the data scientists. The designs were an immediate response to the user feedback that we had captured and shared, but the updated designs were now quite different from the original data scientist creations.
Internal feedback
We received a tidal wave of internal feed back from the data scientists.
Next steps
It became clear that the data scientists were very opinionated, and disagreed with the feedback from our users, and our response to it. We needed to get them back on-side, and not be fighting against them, so we decided to take a step back, and bring them along the journey with us.
We went back in to wireframe mode, creating a set of components first, and then we went through the original designs, and the user feedback together.
The outcome
We used the components as jigsaw pieces to create a response to the user feedback collectively, each one of us sharing our thoughts and ideas throughout the process.
Finally
We re-applied the design system UI, tested the designs again, and synthesised the user feedback.
We then prioritised the changes, made them, and then moved to engineering.
Summary
This project had many challenges along the way, it was not as simple as reusing a tried and tested process, we had to constantly adapt to changing circumstances throughout the project.
It was a data heavy project with a lot to learn and understand from the start, and a carful balancing act between what was right for the business, and what was right for the end user.
The design system that was already in place was weak, and this caused a few usability problems, but we got to a good place in the end, where a new metric could be brought to market, offering a new in-depth and detailed insight in to a brands performance across many segments.
Industry
Insights
Product
SaaS Platform
GFK
GFK are the largest market research company in Germany, and the fourth largest in the world. They provide data and intelligence to the consumer goods industry, enabling brands to compare their own market performance, with that of their competitors.
I joined them during a digital transformation phase, where they were preparing the company for a takeover.
Overview
I was hired to work on a new metric created by the in-house data scientists, called Revenue Premium. This metric combines two other metrics; Price Premium, and Unit Sales. Price Premium is the premium amount a consumer is prepared to pay for your brand, above that of your competitors.
Within Revenue Premium you then have Market Torch, which is effectively a breakdown of your overall score in
to segments, like television screen sizes or price brackets. You can then compare your metrics with your competitors to see where you are strong, and where you can make improvements.
About
Background
- Brands design, manufacture, and sell their products in multiple markets.
- A market is a product category, and region.
- Each product category has its own market segments, such a screen sizes or display technology.
- A brand wants to measure its performance at a brand level, product level, and segment level.
- They measure their performance using multiple metrics.
- They also want to compare themselves against other brands.
Market Torch
I was hired to work on a new metric created by the in-house data scientists, called Revenue Premium. This metric combines two other metrics; Price Premium, and Unit Sales. Price Premium is the premium amount a consumer is prepared to pay for your brand, above that of your competitors.
Within Revenue Premium you then have Market Torch, which is effectively a breakdown of your overall score in
to segments, like television screen sizes or price brackets. You can then compare your metrics with your competitors to see where you are strong, and where you can make improvements.
Example
Two brands may have a similar revenue premium score, similar unit sales and similar price premium, but one brand may be performing well in the high end market (65+ inch £1,000+) where the other brand may be doing well in the low end market (0-32 inch under £300)
Market Torch surfaces where the biggest gaps are, and enables the user to confidently adjust their marketing or manufacturing strategy.
Data science
I was hired to work on a new metric created by the in-house data scientists, called Revenue Premium. This metric combines two other metrics; Price Premium, and Unit Sales. Price Premium is the premium amount a consumer is prepared to pay for your brand, above that of your competitors.
Within Revenue Premium you then have Market Torch, which is effectively a breakdown of your overall score in
to segments, like television screen sizes or price brackets. You can then compare your metrics with your competitors to see where you are strong, and where you can make improvements.
Exploration
We carried out a number of team activities where we explored the concept, and generated new ideas.
What we might need
We listed out what we might need from a features and functionality perspective.
How it might be structured
We put together a mini sitemap of how it might be structured.
MVP
We then agreed on what the MVP should be.
What we showed
Next came the challenging bit. A design system had already been created up-front, which was quite dry and rigid.
This meant that there wasn’t a lot of freedom or flexibility when it came to designing the screens for user testing.

What we used
We used Dovetail for all of our user testing, uploading videos, creating tags, and applying them to the transcripts.
Our insights
Our insights were then generated for all of the different features and functionality parts that we tested.
These were then shared with the wider team, data scientists, and stakeholders.
Topics for discussion
We then re-grouped , and listed out all of our questions and ideas for our next iteration.
Ideas for the next iteration
Based on the insights generated
Prioritisation
Next, we prioritised what should be in the next MVP iteration, and what could move to a version two or three.
Next MVP iteration
We then created our next iteration ready for user testing again.

At this point
We then shared our modified designs with the data scientists. The designs were an immediate response to the user feedback that we had captured and shared, but the updated designs were now quite different from the original data scientist creations.
Internal feedback
We received a tidal wave of internal feed back from the data scientists.
Next steps
It became clear that the data scientists were very opinionated, and disagreed with the feedback from our users, and our response to it. We needed to get them back on-side, and not be fighting against them, so we decided to take a step back, and bring them along the journey with us.
We went back in to wireframe mode, creating a set of components first, and then we went through the original designs, and the user feedback together.
The outcome
We used the components as jigsaw pieces to create a response to the user feedback collectively, each one of us sharing our thoughts and ideas throughout the process.

Finally
We re-applied the design system UI, tested the designs again, and synthesised the user feedback.
We then prioritised the changes, made them, and then moved to engineering.
Summary
This project had many challenges along the way, it was not as simple as reusing a tried and tested process, we had to constantly adapt to changing circumstances throughout the project.
It was a data heavy project with a lot to learn and understand from the start, and a carful balancing act between what was right for the business, and what was right for the end user.
The design system that was already in place was weak, and this caused a few usability problems, but we got to a good place in the end, where a new metric could be brought to market, offering a new in-depth and detailed insight in to a brands performance across many segments.

Industry
Insights
Product
SaaS Platform
GFK
GFK are the largest market research company in Germany, and the fourth largest in the world. They provide data and intelligence to the consumer goods industry, enabling brands to compare their own market performance, with that of their competitors.
I joined them during a digital transformation phase, where they were preparing the company for a takeover.
Overview
I was hired to work on a new metric created by the in-house data scientists, called Revenue Premium. This metric combines two other metrics; Price Premium, and Unit Sales. Price Premium is the premium amount a consumer is prepared to pay for your brand, above that of your competitors.
Within Revenue Premium you then have Market Torch, which is effectively a breakdown of your overall score in
to segments, like television screen sizes or price brackets. You can then compare your metrics with your competitors to see where you are strong, and where you can make improvements.
About
Background
- Brands design, manufacture, and sell their products in multiple markets.
- A market is a product category, and region.
- Each product category has its own market segments, such a screen sizes or display technology.
- A brand wants to measure its performance at a brand level, product level, and segment level.
- They measure their performance using multiple metrics.
- They also want to compare themselves against other brands.
Market Torch
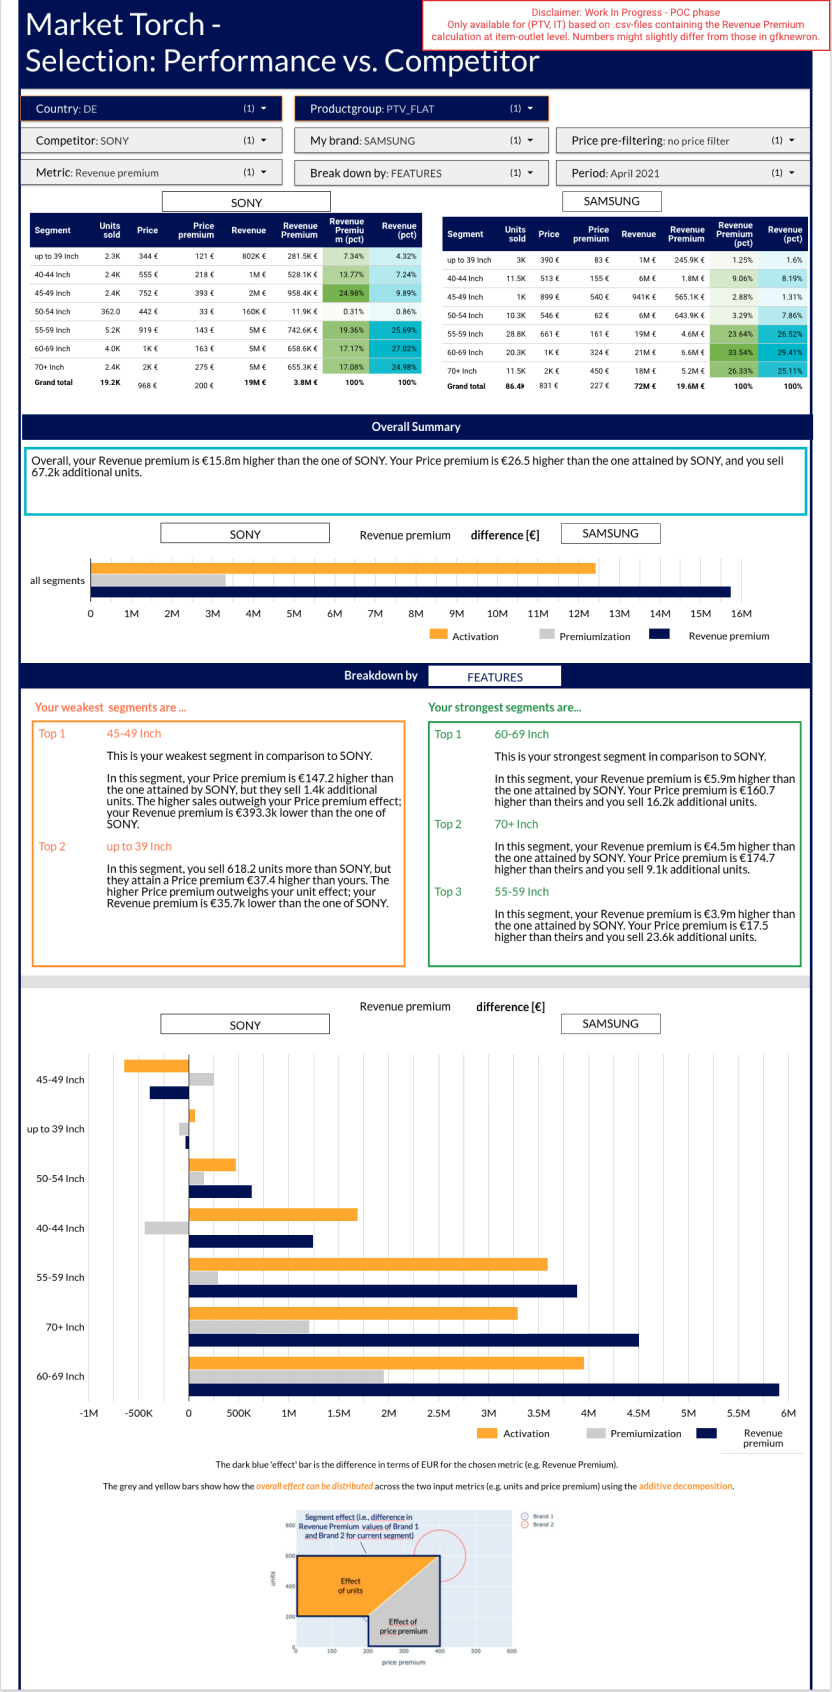
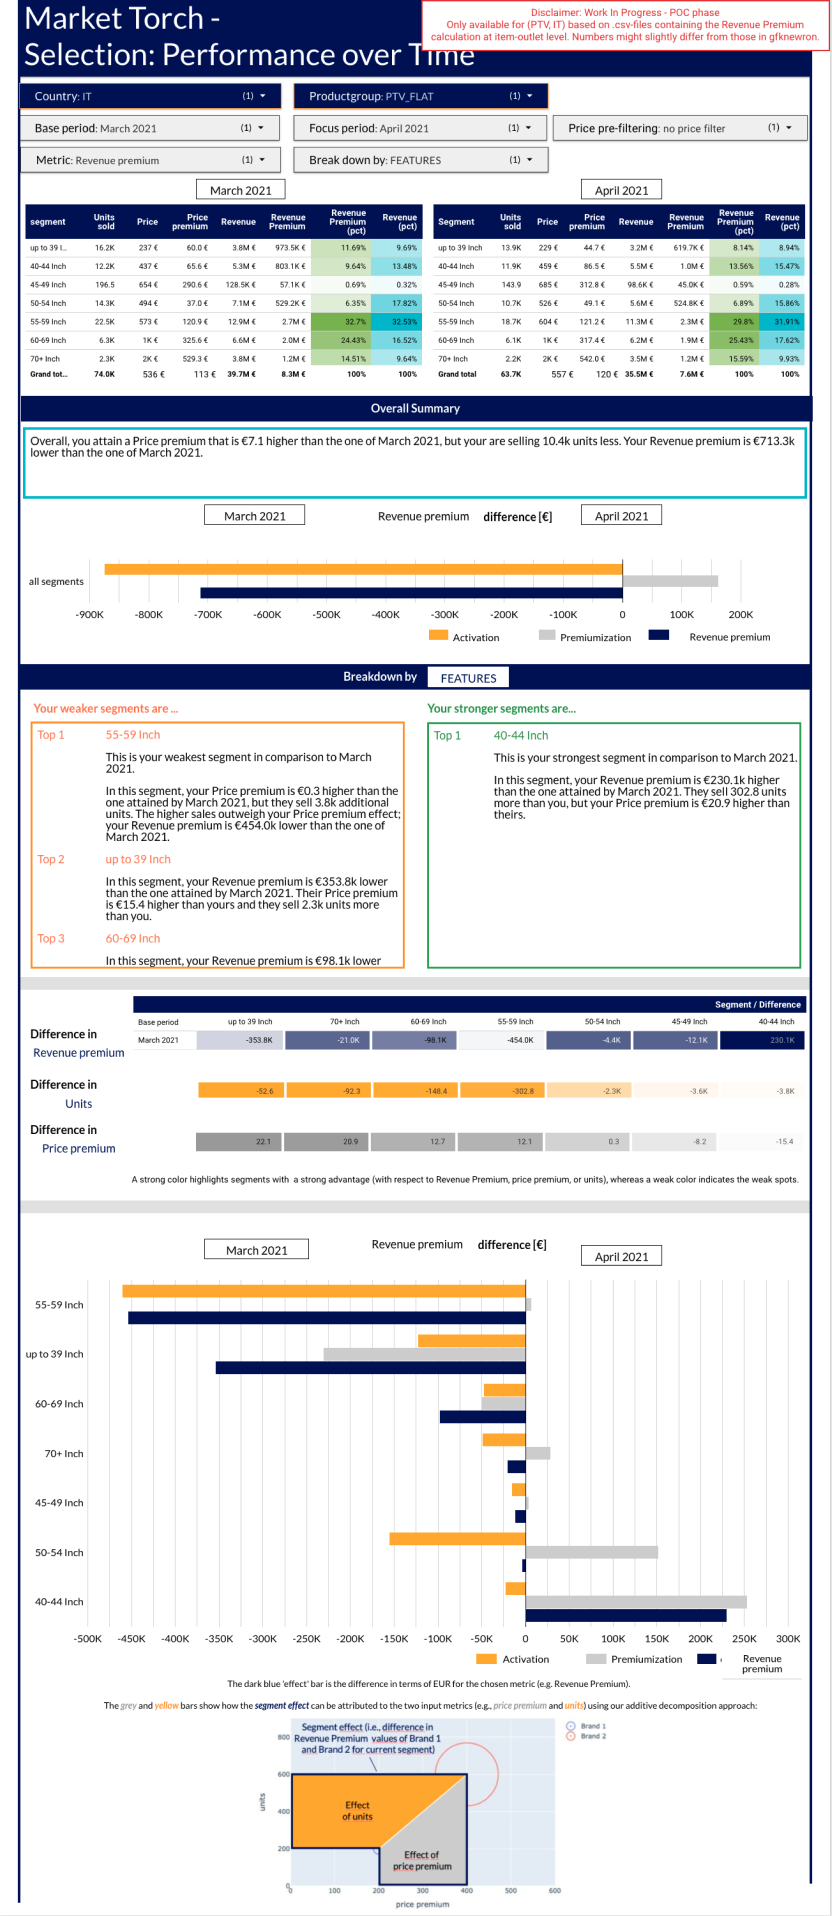
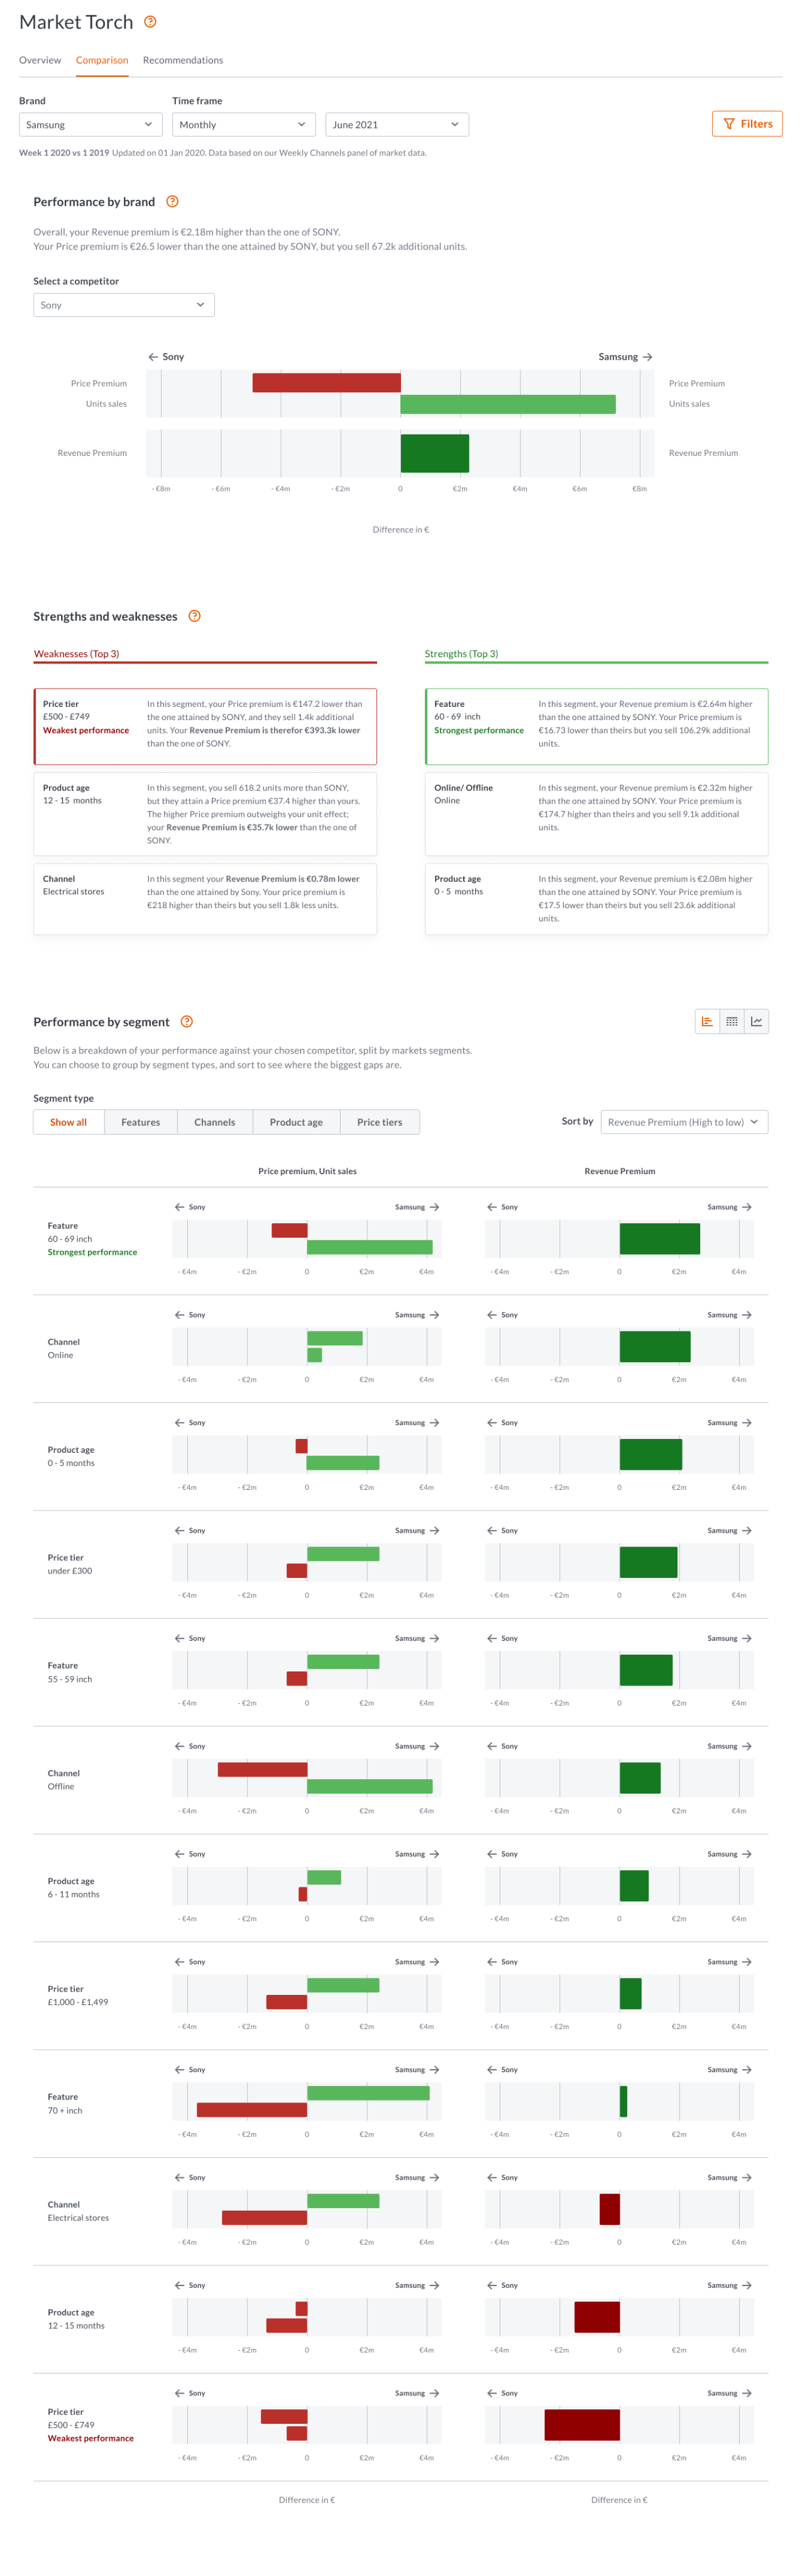
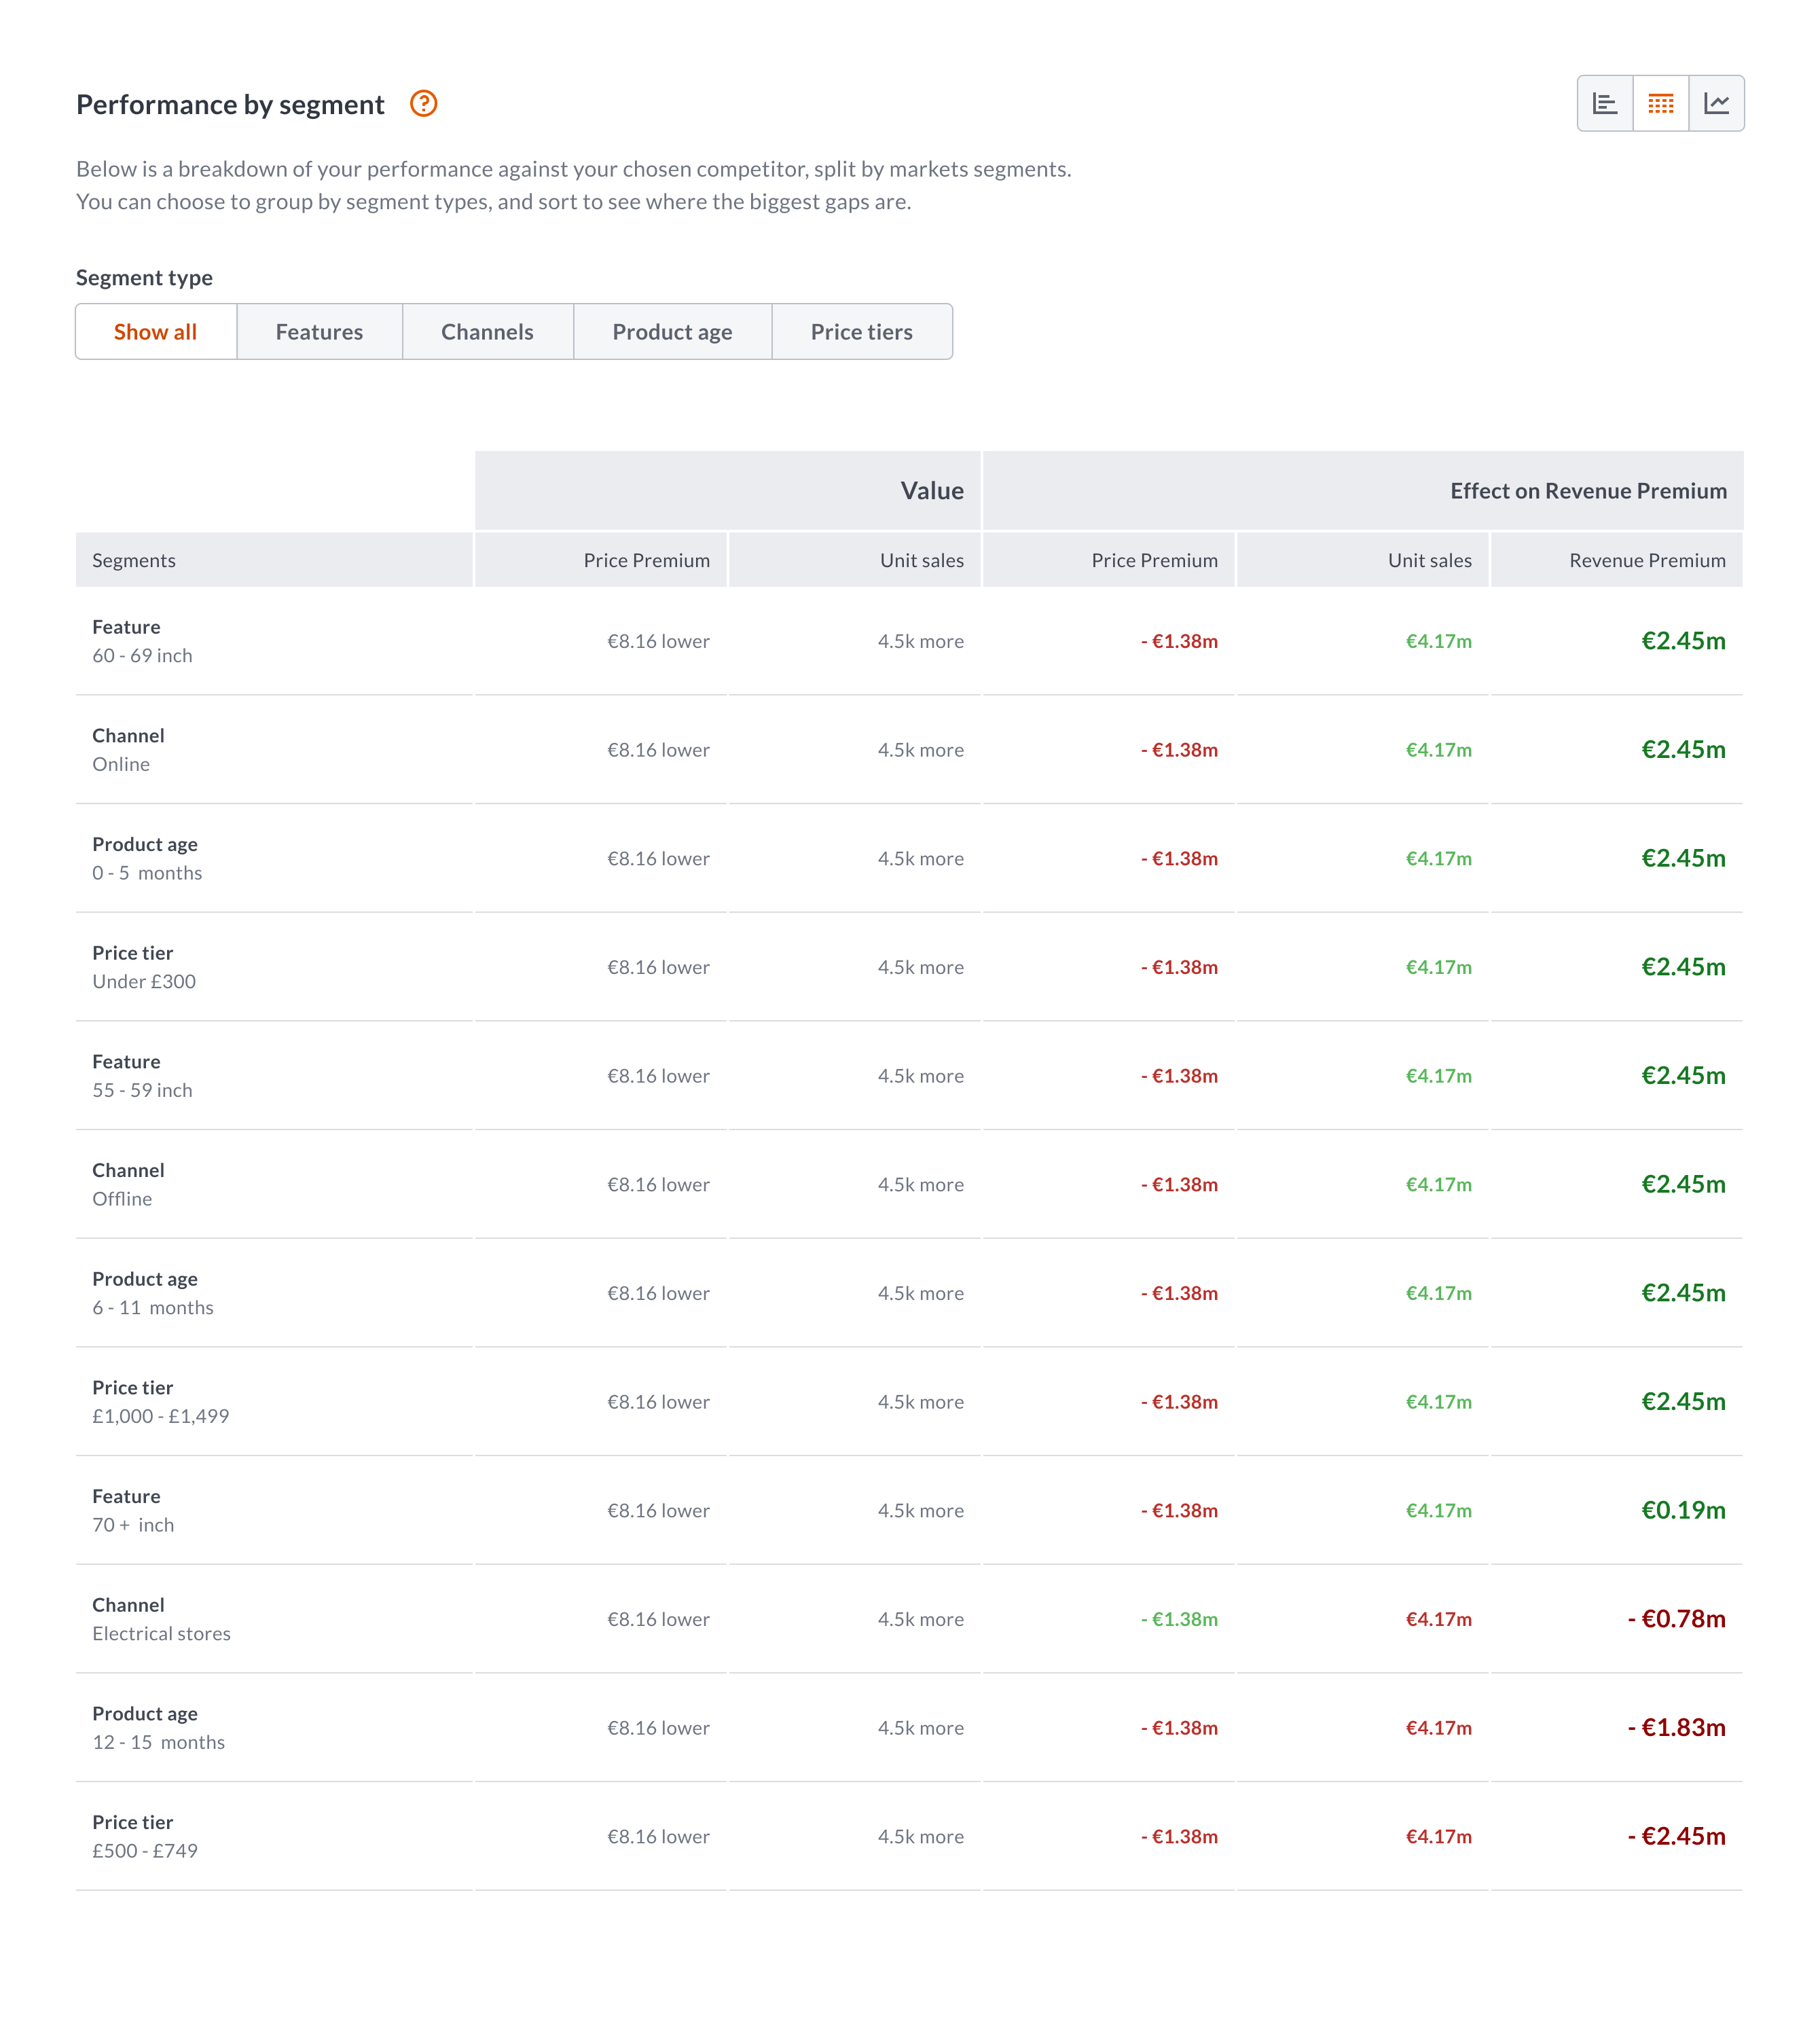
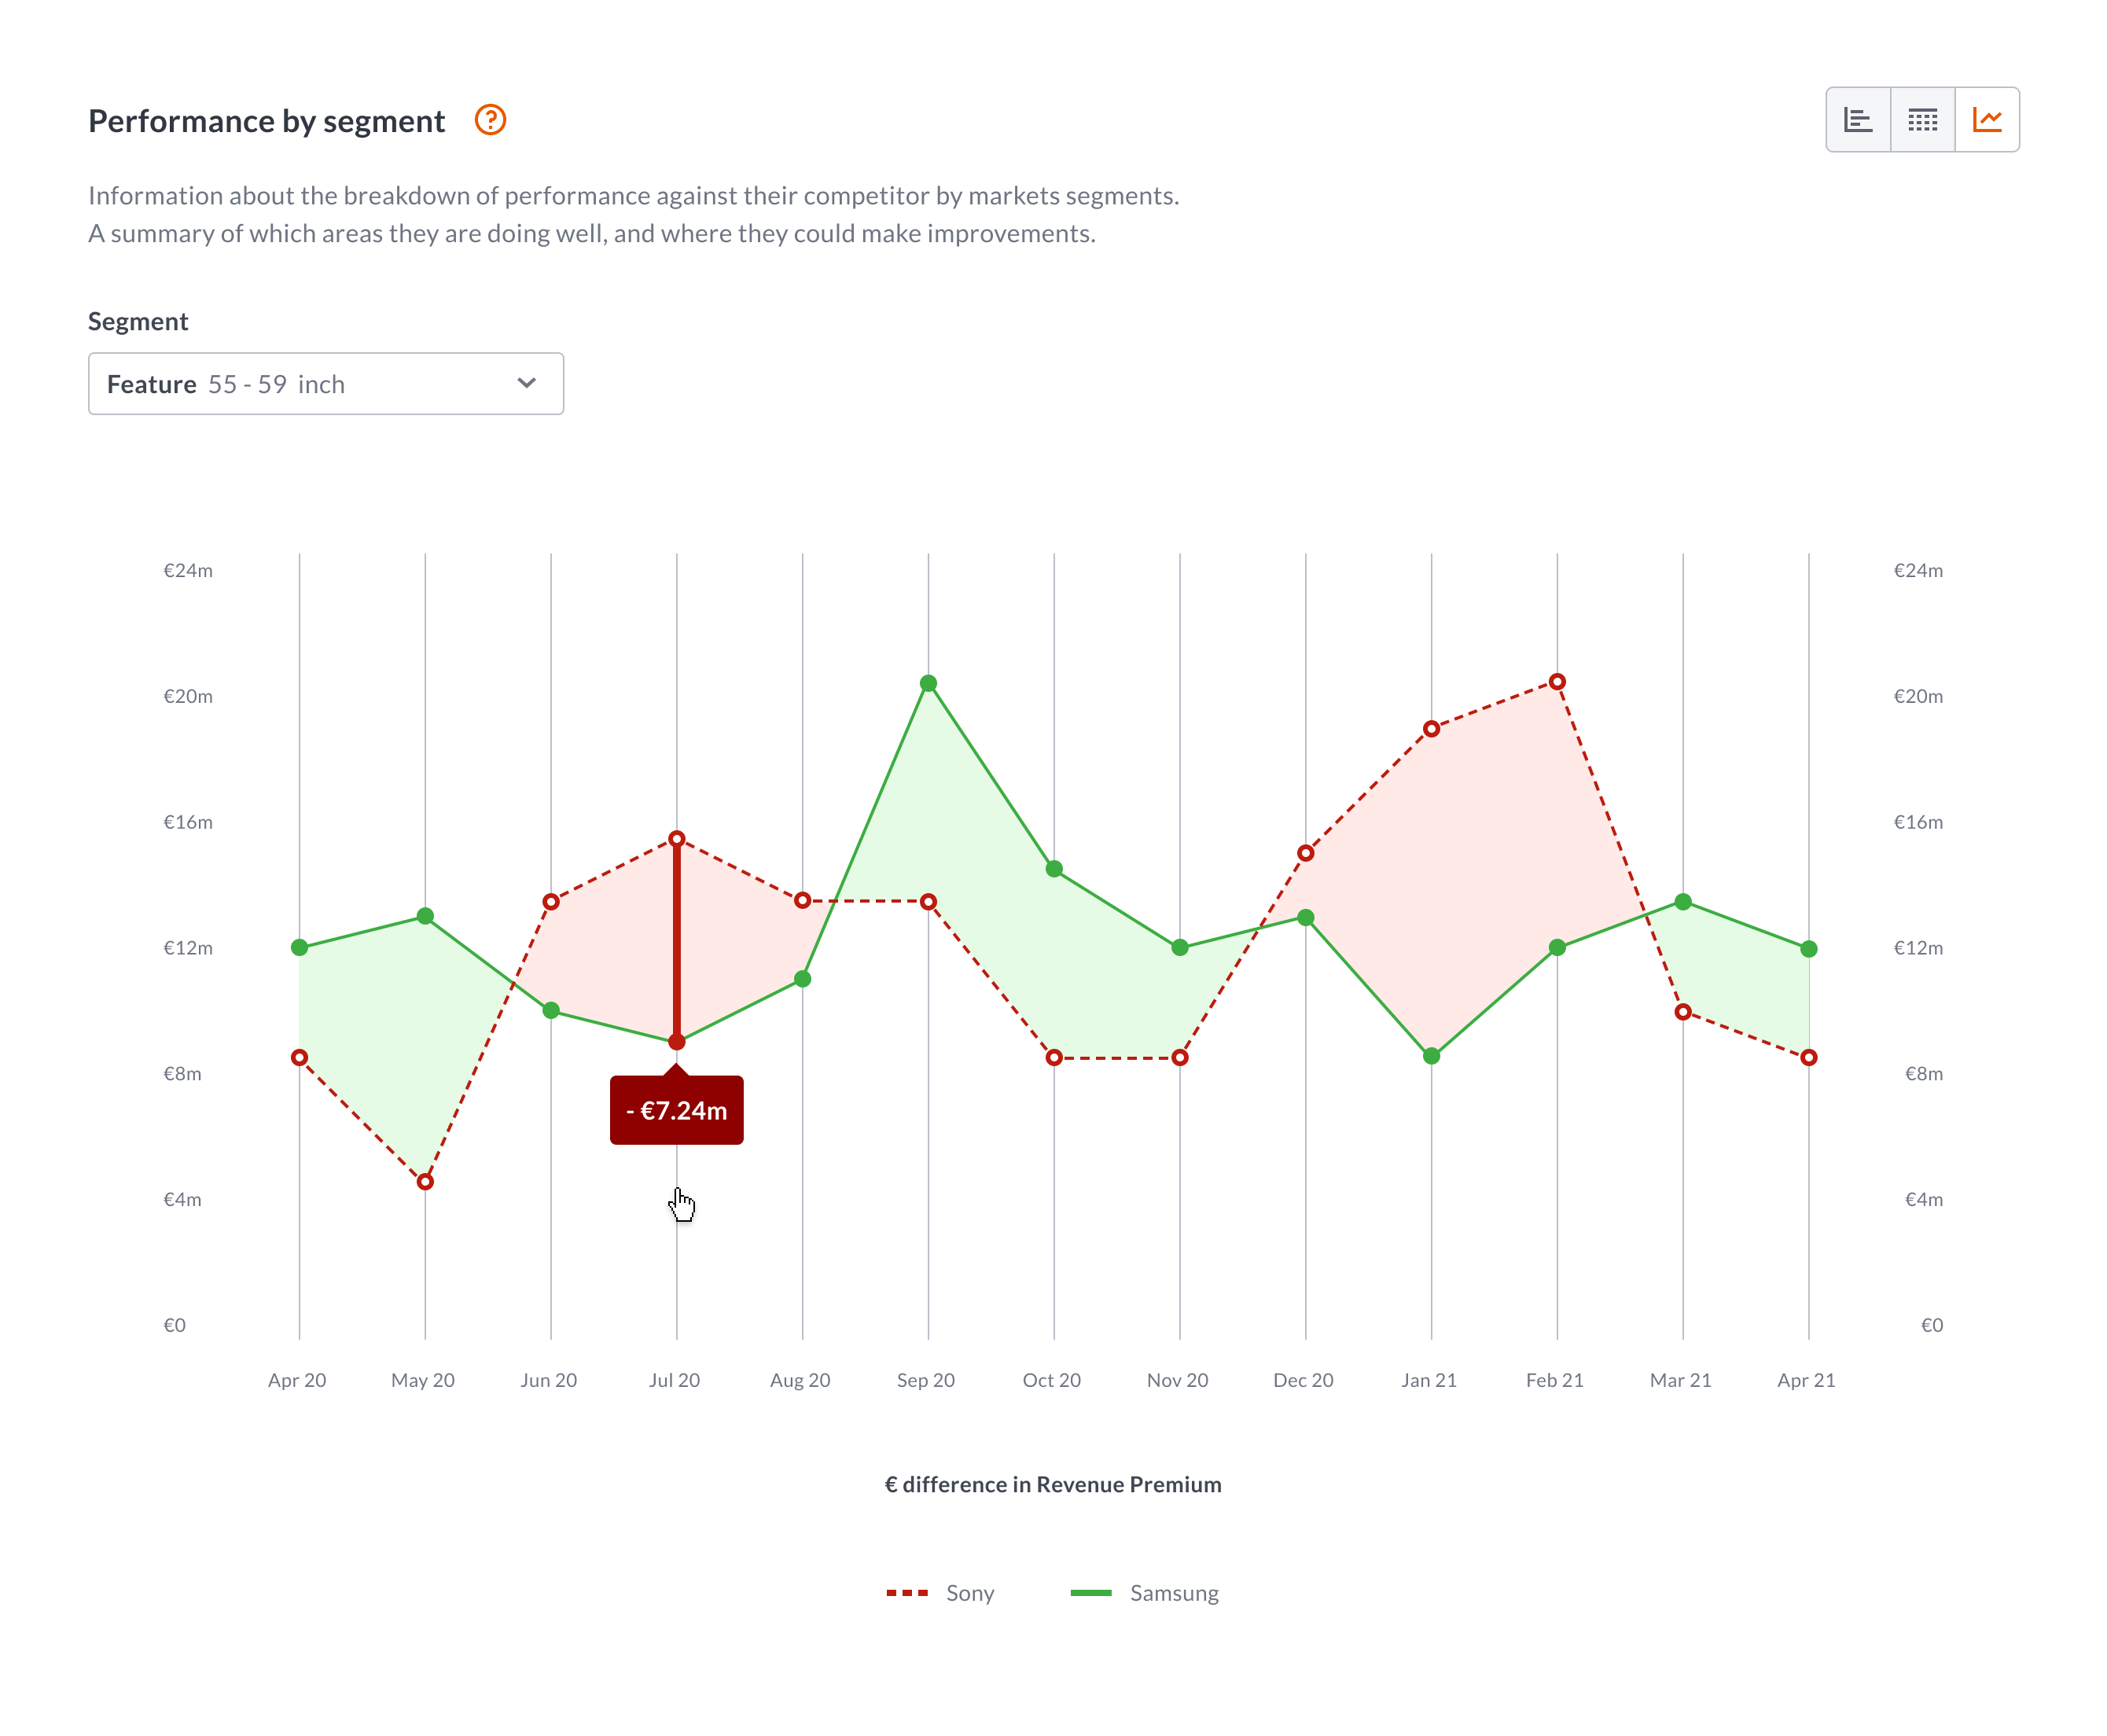
Unlike segmentation, market torch enables the user to see their brand position in a market landscape, identify competitor brands that interest them, then compare those brands against their own, surfacing where the biggest gaps are in their performance at a segment level.
Example
Two brands may have a similar revenue premium score, similar unit sales and similar price premium, but one brand may be performing well in the high end market (65+ inch £1,000+) where the other brand may be doing well in the low end market (0-32 inch under £300)
Market Torch surfaces where the biggest gaps are, and enables the user to confidently adjust their marketing or manufacturing strategy.
Data science
I was hired to work on a new metric created by the in-house data scientists, called Revenue Premium. This metric combines two other metrics; Price Premium, and Unit Sales. Price Premium is the premium amount a consumer is prepared to pay for your brand, above that of your competitors.
Within Revenue Premium you then have Market Torch, which is effectively a breakdown of your overall score in
to segments, like television screen sizes or price brackets. You can then compare your metrics with your competitors to see where you are strong, and where you can make improvements.
Exploration
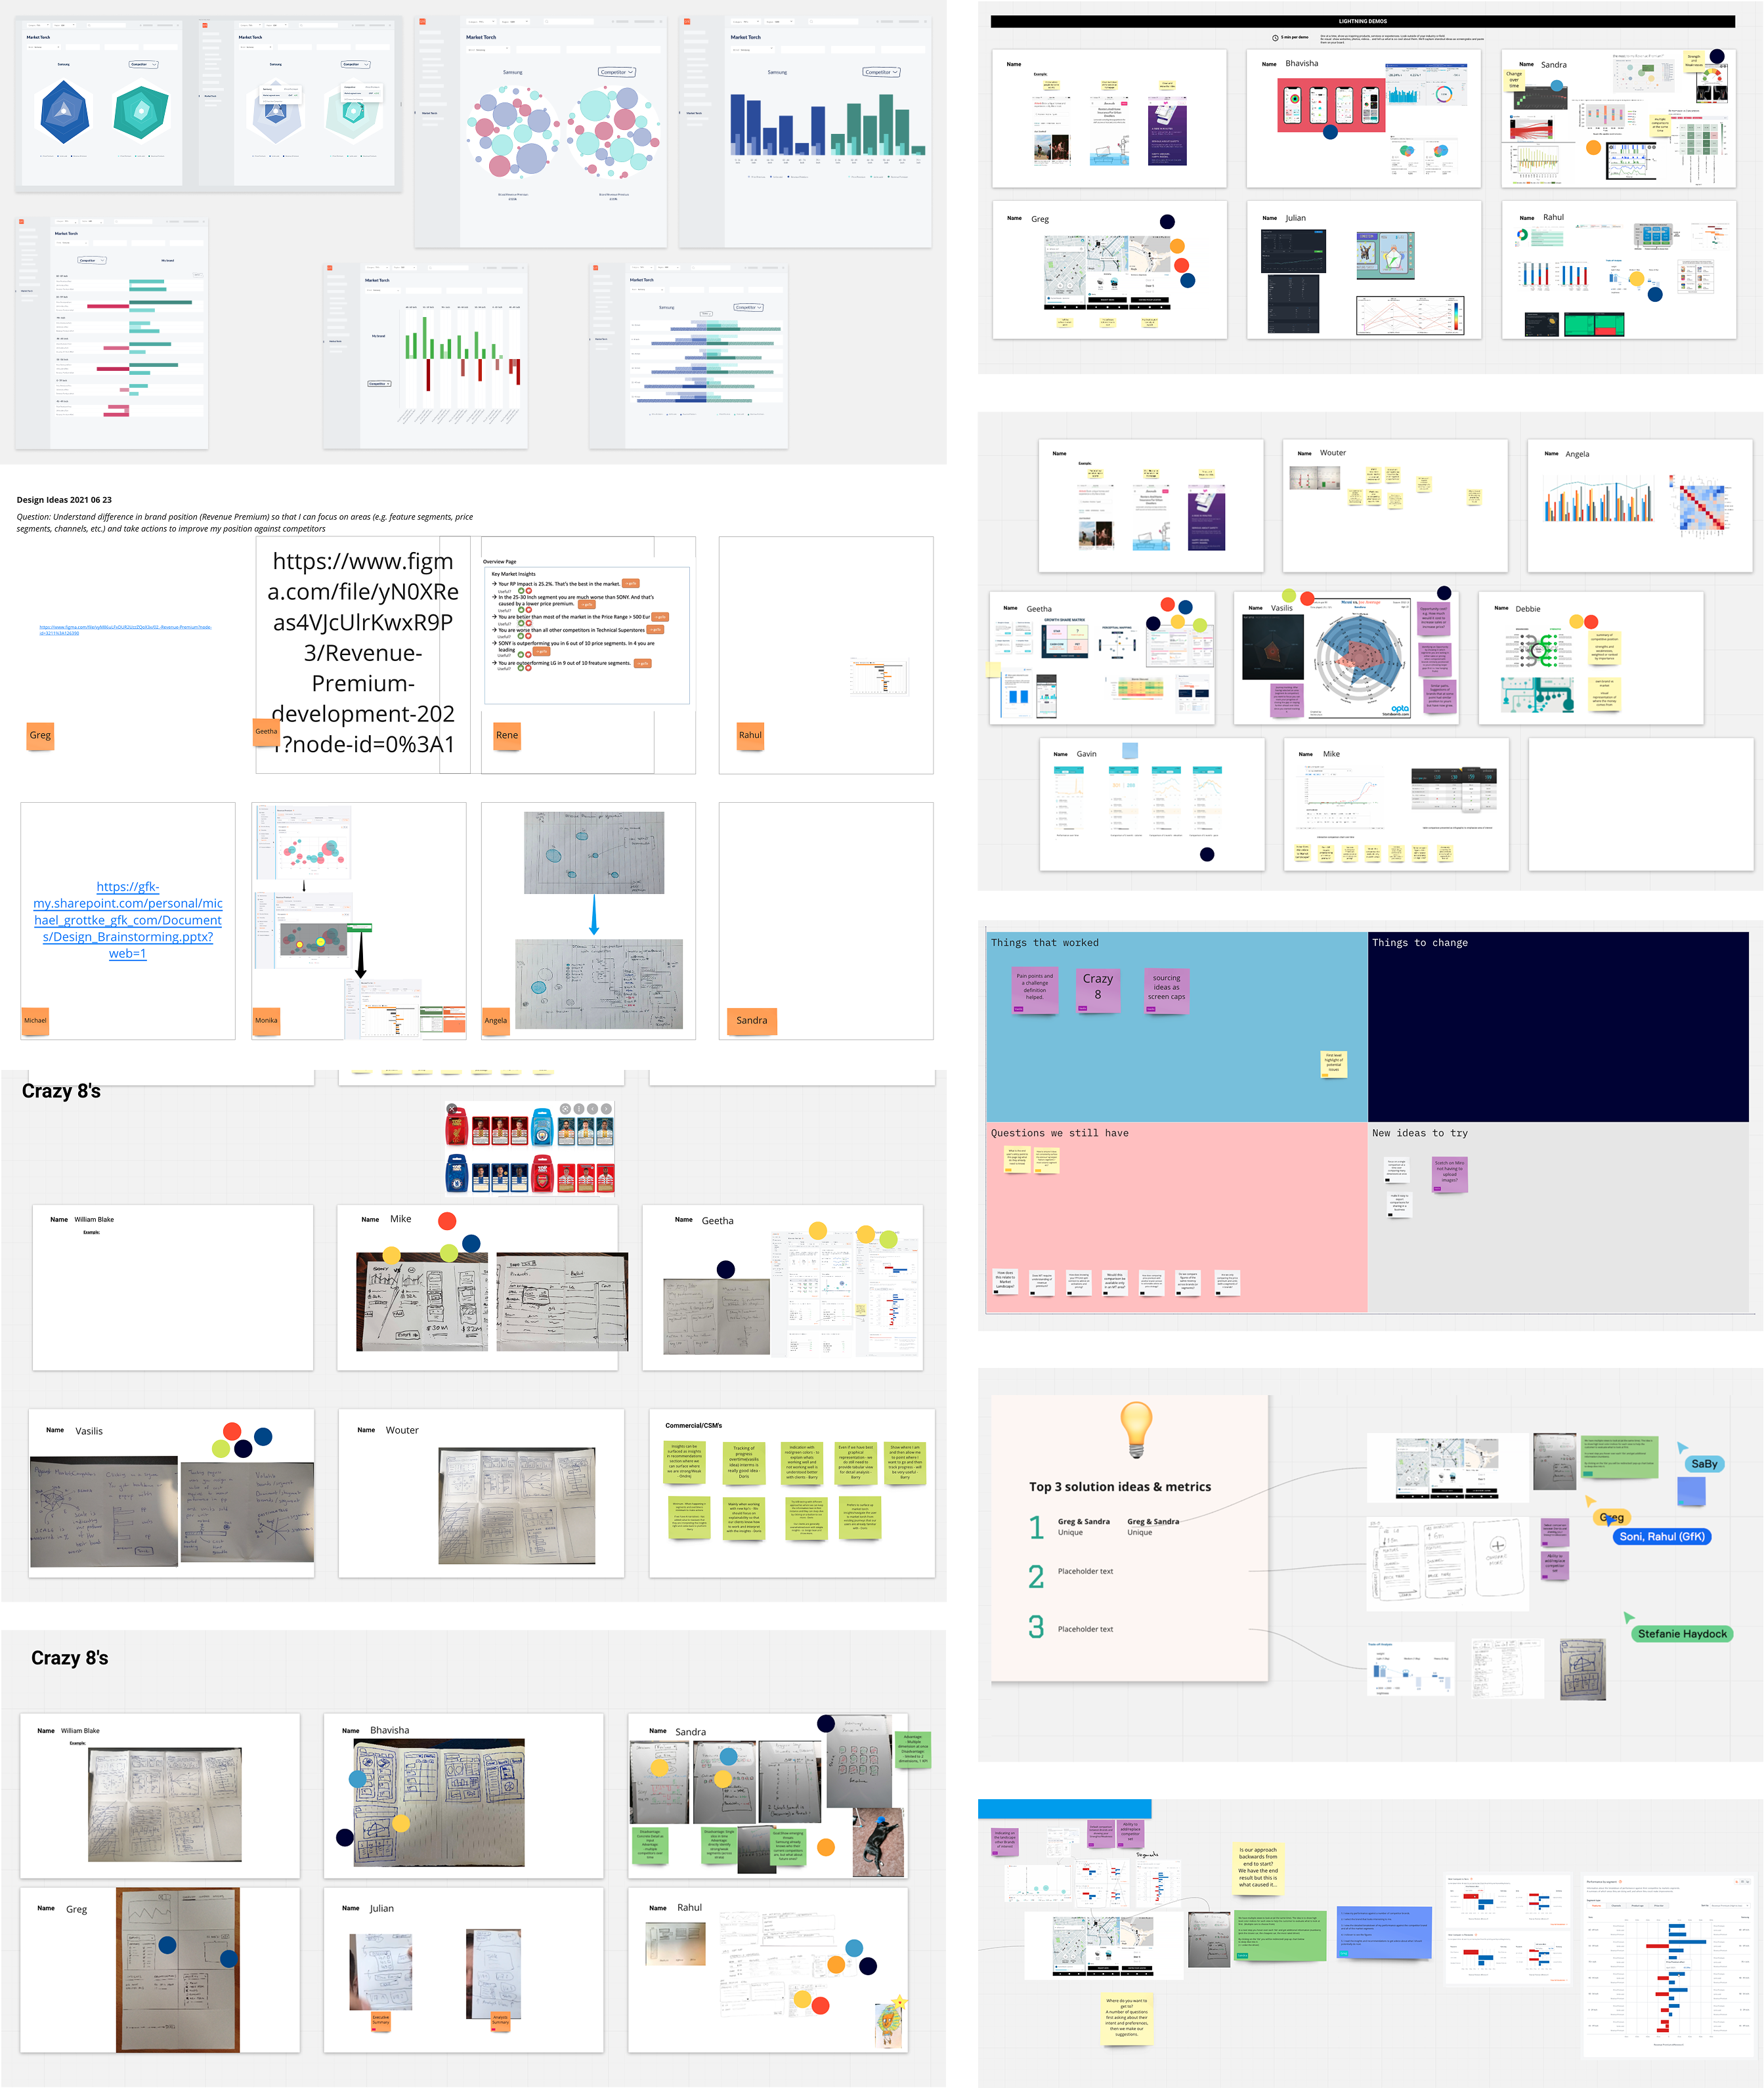
We carried out a number of team activities where we explored the concept, and generated new ideas.
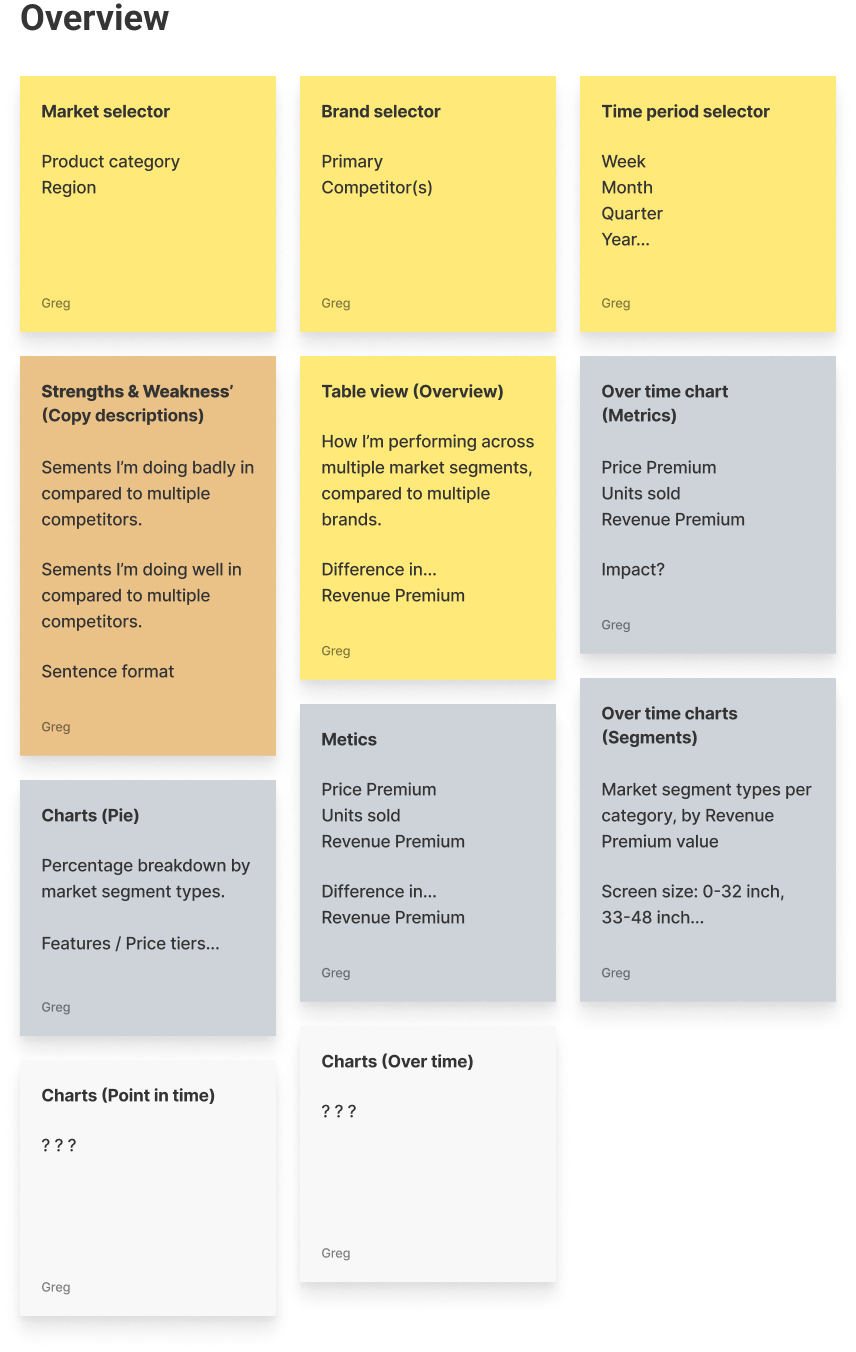
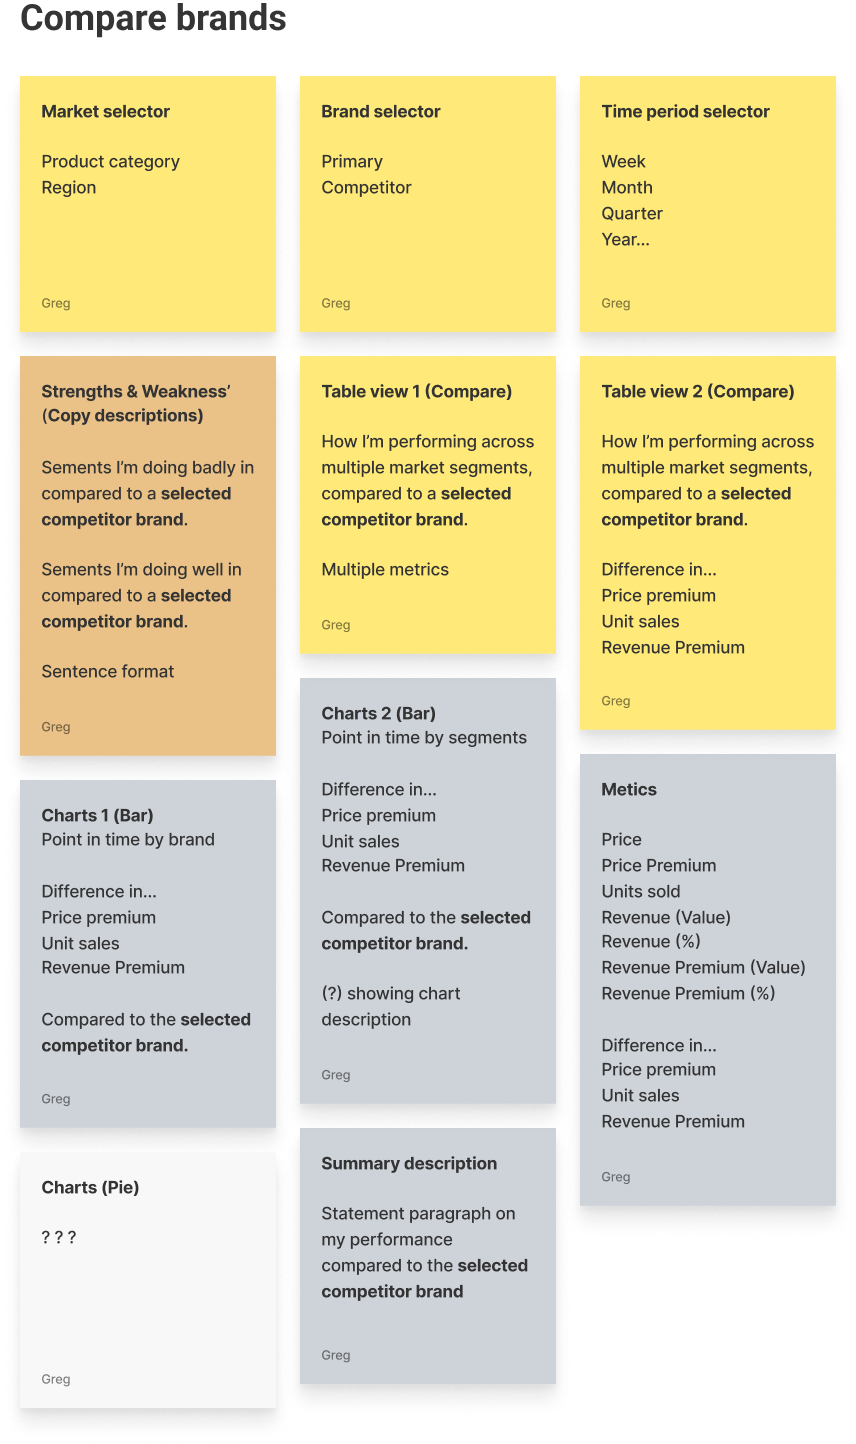
What we might need
We listed out what we might need from a features and functionality perspective.
How it might be structured
We put together a mini sitemap of how it might be structured.
MVP
We then agreed on what the MVP should be.
What we showed
Next came the challenging bit. A design system had already been created up-front, which was quite dry and rigid.
This meant that there wasn’t a lot of freedom or flexibility when it came to designing the screens for user testing.

What we used
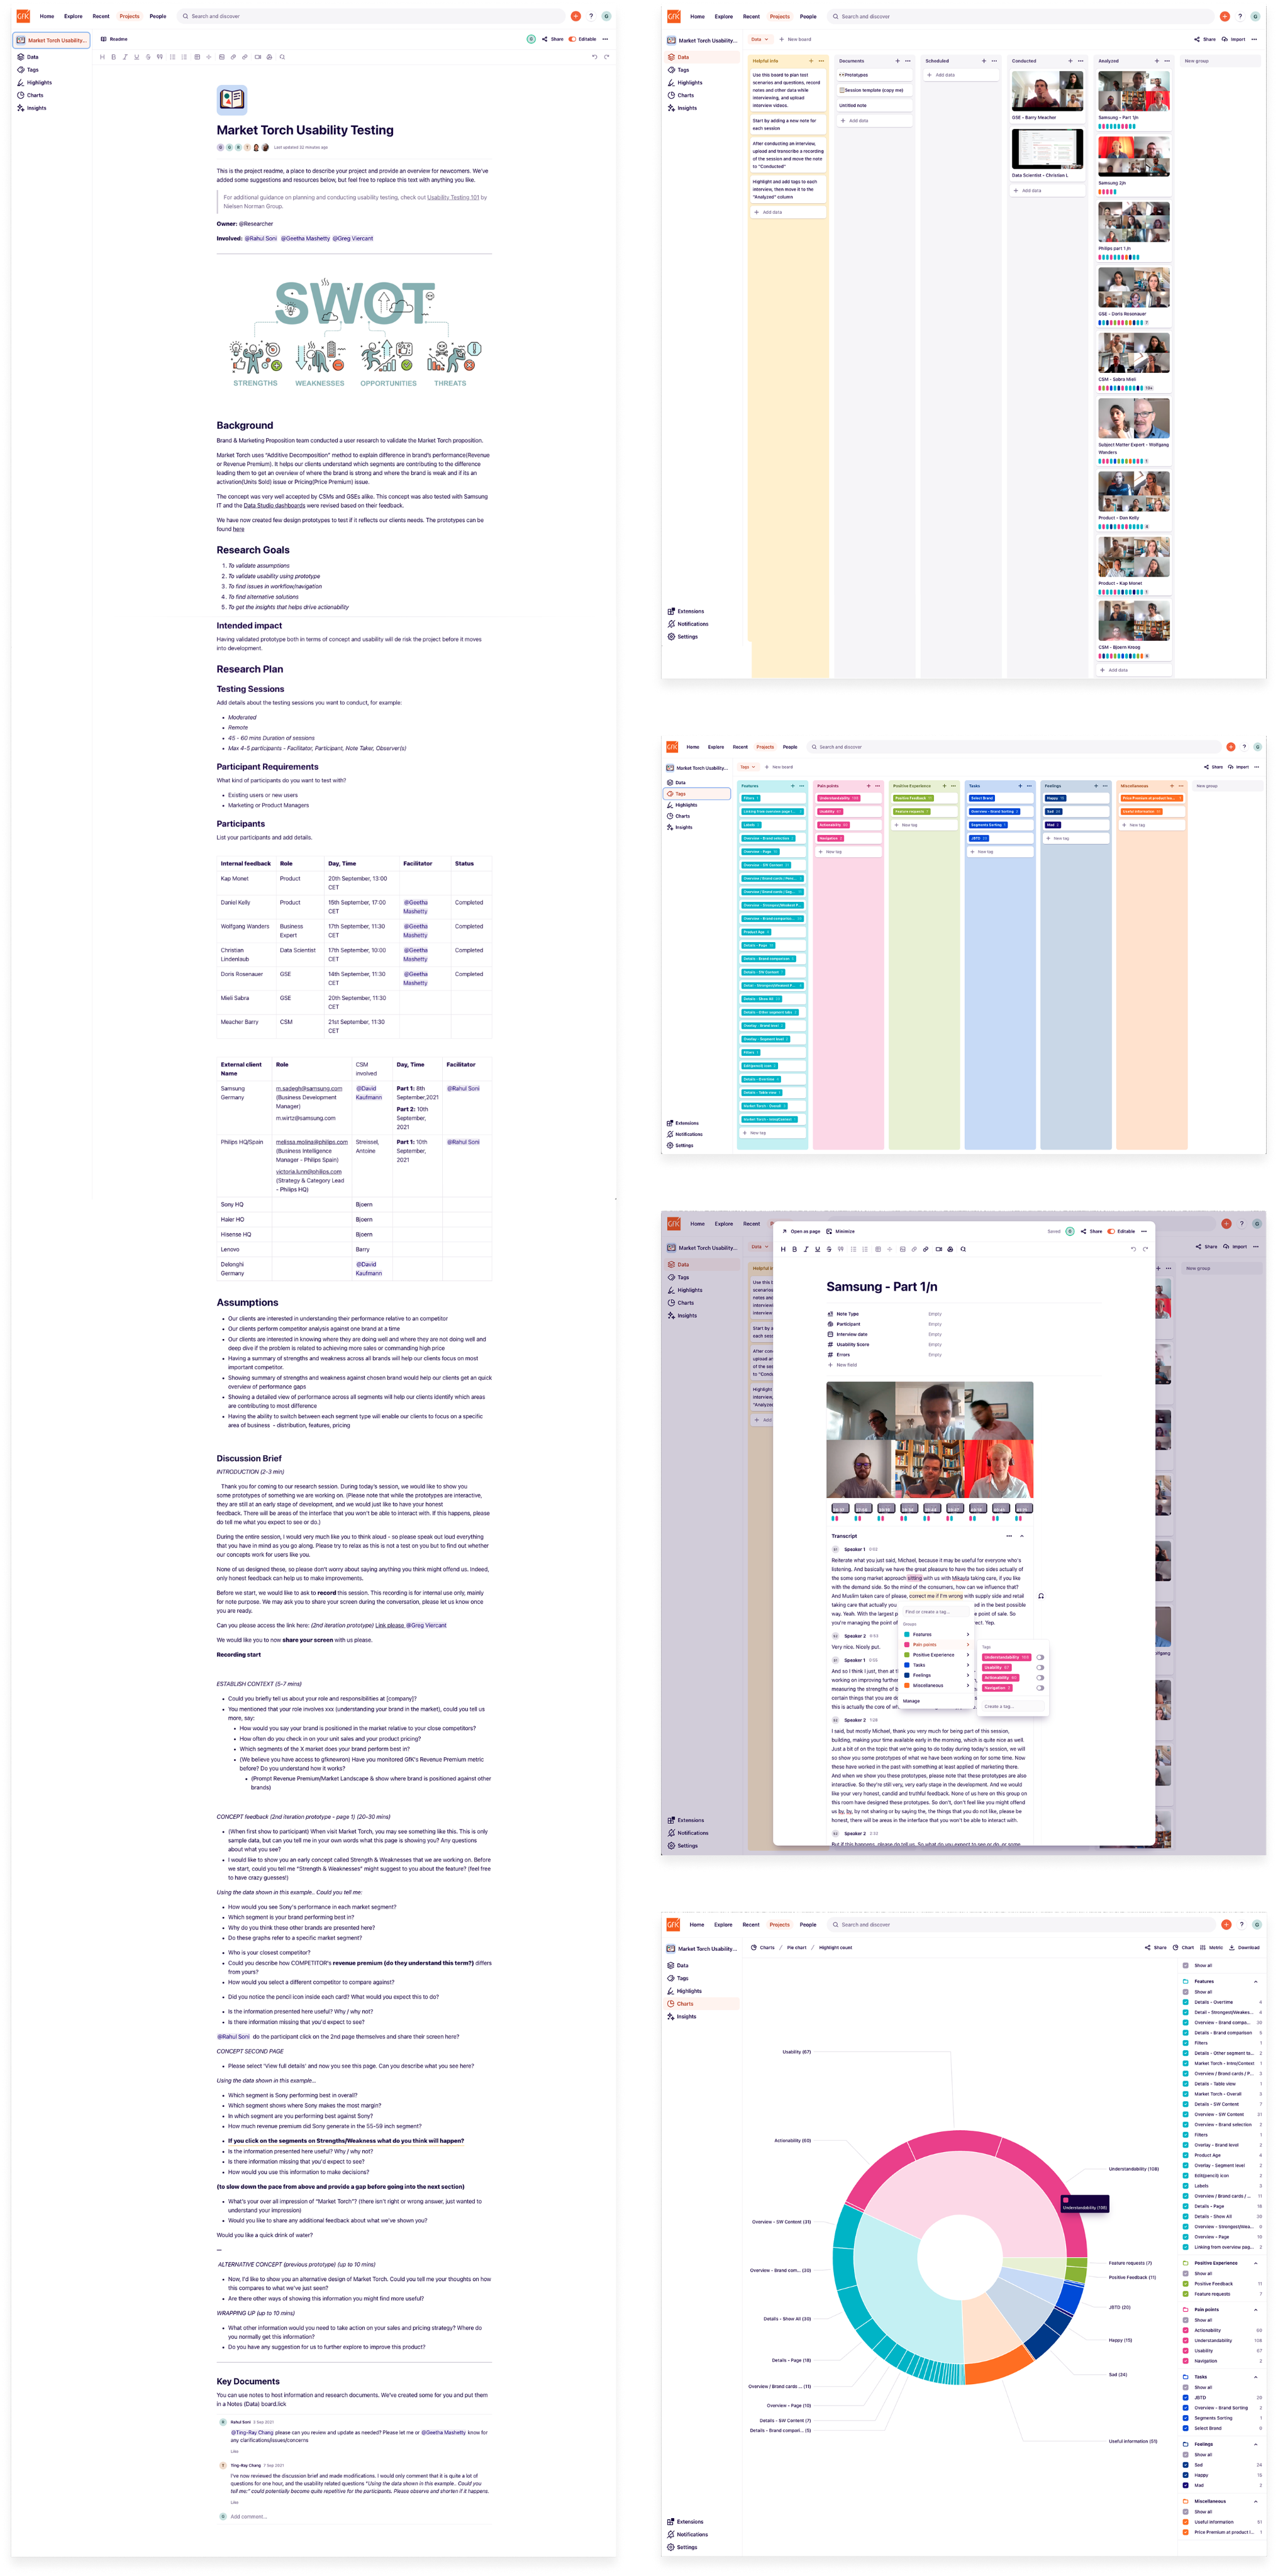
We used Dovetail for all of our user testing, uploading videos, creating tags, and applying them to the transcripts.
Our insights
Our insights were then generated for all of the different features and functionality parts that we tested.
These were then shared with the wider team, data scientists, and stakeholders.
Topics for discussion
We then re-grouped , and listed out all of our questions and ideas for our next iteration.
Ideas for the next iteration
Based on the insights generated
Prioritisation
Next, we prioritised what should be in the next MVP iteration, and what could move to a version two or three.
Next MVP iteration
We then created our next iteration ready for user testing again.
At this point
We then shared our modified designs with the data scientists. The designs were an immediate response to the user feedback that we had captured and shared, but the updated designs were now quite different from the original data scientist creations.
Internal feedback
We received a tidal wave of internal feed back from the data scientists.
Next steps
It became clear that the data scientists were very opinionated, and disagreed with the feedback from our users, and our response to it. We needed to get them back on-side, and not be fighting against them, so we decided to take a step back, and bring them along the journey with us.
We went back in to wireframe mode, creating a set of components first, and then we went through the original designs, and the user feedback together.
The outcome
We used the components as jigsaw pieces to create a response to the user feedback collectively, each one of us sharing our thoughts and ideas throughout the process.
Finally
We re-applied the design system UI, tested the designs again, and synthesised the user feedback.
We then prioritised the changes, made them, and then moved to engineering.
Summary
This project had many challenges along the way, it was not as simple as reusing a tried and tested process, we had to constantly adapt to changing circumstances throughout the project.
It was a data heavy project with a lot to learn and understand from the start, and a carful balancing act between what was right for the business, and what was right for the end user.
The design system that was already in place was weak, and this caused a few usability problems, but we got to a good place in the end, where a new metric could be brought to market, offering a new in-depth and detailed insight in to a brands performance across many segments.

Industry
Insights
Product
SaaS Platform
GFK
GFK are the largest market research company in Germany, and the fourth largest in the world. They provide data and intelligence to the consumer goods industry, enabling brands to compare their own market performance, with that of their competitors.
I joined them during a digital transformation phase, where they were preparing the company for a takeover.
Overview
I was hired to work on a new metric created by the in-house data scientists, called Revenue Premium. This metric combines two other metrics; Price Premium, and Unit Sales. Price Premium is the premium amount a consumer is prepared to pay for your brand, above that of your competitors.
Within Revenue Premium you then have Market Torch, which is effectively a breakdown of your overall score in
to segments, like television screen sizes or price brackets. You can then compare your metrics with your competitors to see where you are strong, and where you can make improvements.
About
Background
- Brands design, manufacture, and sell their products in multiple markets.
- A market is a product category, and region.
- Each product category has its own market segments, such a screen sizes or display technology.
- A brand wants to measure its performance at a brand level, product level, and segment level.
- They measure their performance using multiple metrics.
- They also want to compare themselves against other brands.
Market Torch
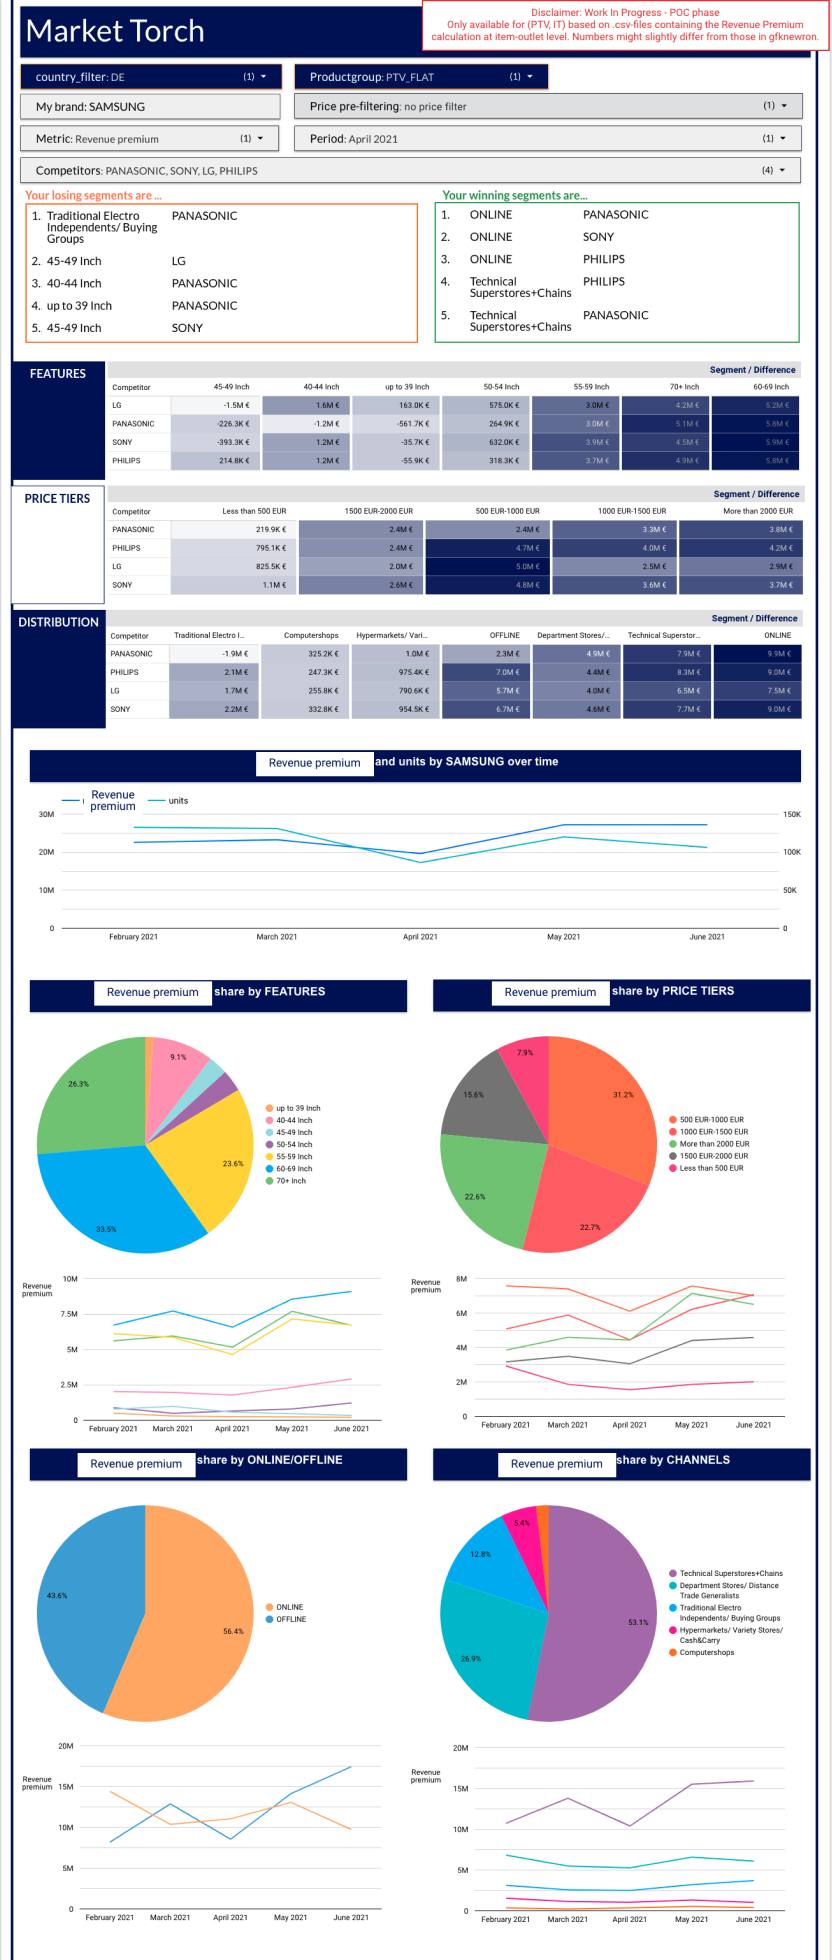
Unlike segmentation, market torch enables the user to see their brand position in a market landscape, identify competitor brands that interest them, then compare those brands against their own, surfacing where the biggest gaps are in their performance at a segment level.
Example
Two brands may have a similar revenue premium score, similar unit sales and similar price premium, but one brand may be performing well in the high end market (65+ inch £1,000+) where the other brand may be doing well in the low end market (0-32 inch under £300)
Market Torch surfaces where the biggest gaps are, and enables the user to confidently adjust their marketing or manufacturing strategy.
Data science
I was hired to work on a new metric created by the in-house data scientists, called Revenue Premium. This metric combines two other metrics; Price Premium, and Unit Sales. Price Premium is the premium amount a consumer is prepared to pay for your brand, above that of your competitors.
Within Revenue Premium you then have Market Torch, which is effectively a breakdown of your overall score in
to segments, like television screen sizes or price brackets. You can then compare your metrics with your competitors to see where you are strong, and where you can make improvements.
Exploration
We carried out a number of team activities where we explored the concept, and generated new ideas.
What we might need
We listed out what we might need from a features and functionality perspective.
How it might be structured
We put together a mini sitemap of how it might be structured.
MVP
We then agreed on what the MVP should be.
What we showed
Next came the challenging bit. A design system had already been created up-front, which was quite dry and rigid.
This meant that there wasn’t a lot of freedom or flexibility when it came to designing the screens for user testing.

What we used
We used Dovetail for all of our user testing, uploading videos, creating tags, and applying them to the transcripts.
Our insights
Our insights were then generated for all of the different features and functionality parts that we tested.
These were then shared with the wider team, data scientists, and stakeholders.
Topics for discussion
We then re-grouped , and listed out all of our questions and ideas for our next iteration.
Ideas for the next iteration
Based on the insights generated
Prioritisation
Next, we prioritised what should be in the next MVP iteration, and what could move to a version two or three.
Next MVP iteration
We then created our next iteration ready for user testing again.
At this point
We then shared our modified designs with the data scientists. The designs were an immediate response to the user feedback that we had captured and shared, but the updated designs were now quite different from the original data scientist creations.
Internal feedback
We received a tidal wave of internal feed back from the data scientists.
Next steps
It became clear that the data scientists were very opinionated, and disagreed with the feedback from our users, and our response to it. We needed to get them back on-side, and not be fighting against them, so we decided to take a step back, and bring them along the journey with us.
We went back in to wireframe mode, creating a set of components first, and then we went through the original designs, and the user feedback together.
The outcome
We used the components as jigsaw pieces to create a response to the user feedback collectively, each one of us sharing our thoughts and ideas throughout the process.
Finally
We re-applied the design system UI, tested the designs again, and synthesised the user feedback.
We then prioritised the changes, made them, and then moved to engineering.
Summary
This project had many challenges along the way, it was not as simple as reusing a tried and tested process, we had to constantly adapt to changing circumstances throughout the project.
It was a data heavy project with a lot to learn and understand from the start, and a carful balancing act between what was right for the business, and what was right for the end user.
The design system that was already in place was weak, and this caused a few usability problems, but we got to a good place in the end, where a new metric could be brought to market, offering a new in-depth and detailed insight in to a brands performance across many segments.